. 2019 Jun;34(6):1068-1073.
doi: 10.1002/jbmr.3686. Epub 2019 Feb 21.

Obesity Decreases Hepatic 25-Hydroxylase Activity Causing Low Serum 25-Hydroxyvitamin D

Affiliations

Obesity Decreases Hepatic 25-Hydroxylase Activity Causing Low Serum 25-Hydroxyvitamin D

Jeffrey D Roizen et al. J Bone Miner Res. 2019 Jun.

Abstract

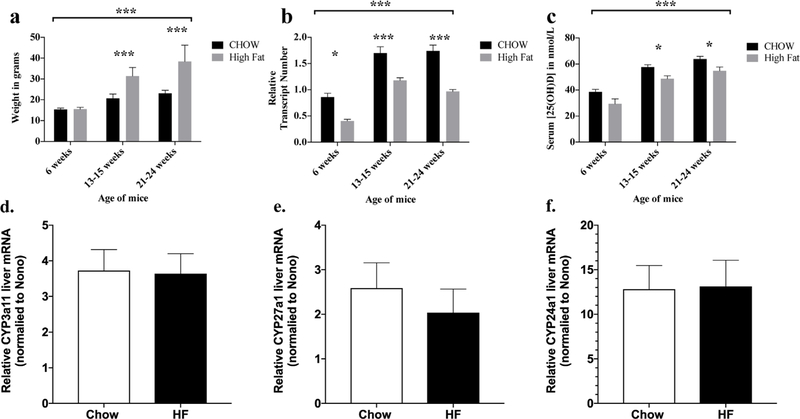
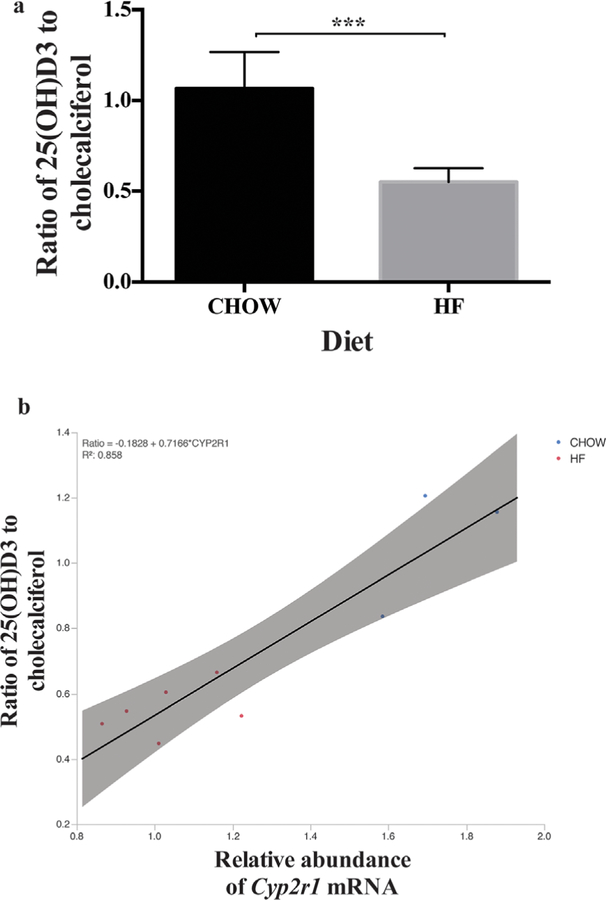
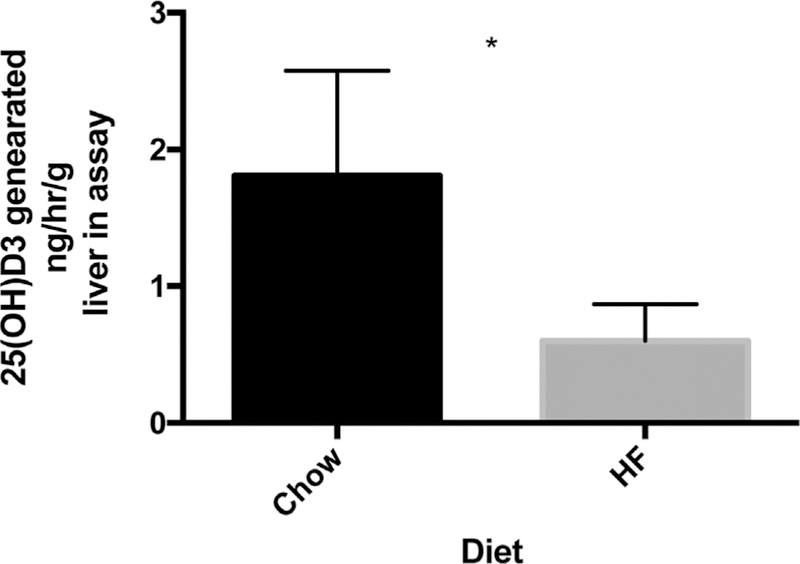
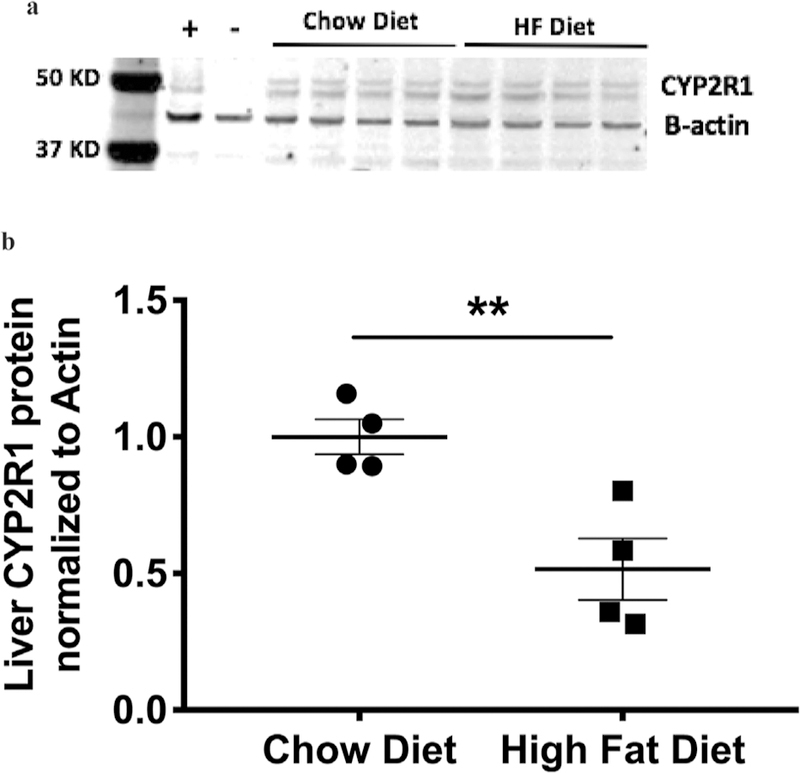
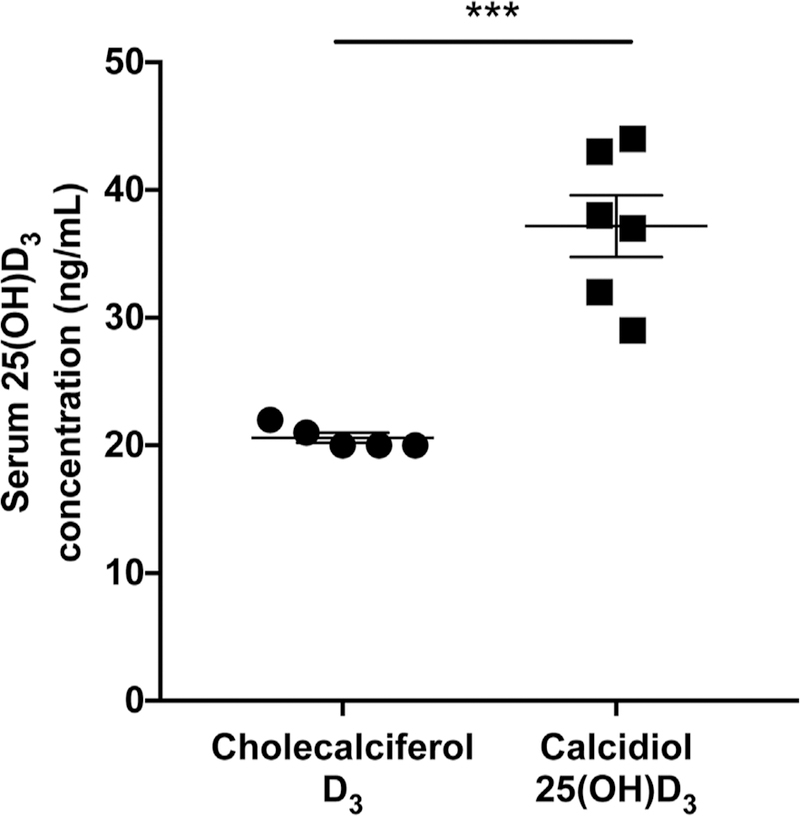
Normal vitamin D homeostasis is critical for optimal health; nevertheless, vitamin D deficiency is a worldwide public health problem. Vitamin D insufficiency is most commonly due to inadequate cutaneous synthesis of cholecalciferol and/or insufficient intake of vitamin D, but can also arise as a consequence of pathological states such as obesity. Serum concentrations of 25(OH)D (calcidiol) are low in obesity, and fail to increase appropriately after vitamin D supplementation. Although sequestration of vitamin D in adipose tissues or dilution of ingested or cutaneously synthesized vitamin D in the large fat mass of obese patients has been proposed to explain these findings, here we investigate the alternative mechanism that reduced capacity to convert parent vitamin D to 25(OH)D due to decreased expression of CYP2R1, the principal hepatic vitamin D 25-hydroxylase. To test this hypothesis, we isolated livers from female mice of 6 to 24 weeks of age, weaned onto either a normal chow diet or a high-fat diet, and determined the abundance of Cyp2r1 mRNA using digital droplet-quantitative PCR. We observed a significant (p < 0.001) decrease in Cyp2r1 mRNA in the liver of high-fat diet-fed mice relative to lean-chow-fed female mice. Moreover, there was a significant (p < 0.01) relationship between levels of Cyp2r1 mRNA and serum 25(OH)D concentrations as well as between Cyp2R1 mRNA and the ratio of circulating 25(OH)D3 to cholecalciferol (p < 0.0001). Using linear regression we determined a curve with 25(OH)D3/cholecalciferol versus normalized Cyp2R1 mRNA abundance with an R2 value of 0.85. Finally, we performed ex vivo activity assays of isolated livers and found that obese mice generated significantly less 25(OH)D3 than lean mice (p < 0.05). Our findings indicate that expression of CYP2R1 is reduced in obesity and accounts in part for the decreased circulating 25(OH)D. © 2019 American Society for Bone and Mineral Research.

Keywords: CYP2R1; OBESITY; P450; VITAMIN D.


Conflict of interest statement

Disclosures

All authors state that they have no conflicts of interest to disclose.

Figures

Fig. 1
Fig. 1
(A) Weight is increased on a high-fat diet by 13 weeks on diet. Mice were started on a high-fat diet at weaning at 3 weeks of age. Overall groups were significantly different (*** p < 0.001 by two-way ANOVA), subgroups were different at 13 to 15 weeks and 21 to 24 weeks of age (Sidak’s multiple comparison posttests, *** p < 0.001 for each). (B) Relative Cyp2r1 liver mRNA abundance is decreased on high-fat diet. Relative abundance of Cyp2r1 mRNA and Nono mRNA were determined by digital droplet quantitative PCR, and Cyp2r1 was normalized to Nono abundance in each sample. Overall groups were different (*** p < 0.001 by two-way ANOVA), subgroups were different at 6, 13 to 15, and 21 to 24 weeks of age (Sidak’s multiple comparison post-tests, * p < 0.05 at 6 weeks, *** p < 0.001 at 13 to 15 and 21 to 24 weeks). (C) Serum 25(OH)D is decreased in parallel with Cyp2R1 mRNA abundance on high-fat diet. Serum 25(OH)D was determined by LC/MS/MS. Overall groups were different (* p < 0.01 by two-way ANOVA), subgroups were different at 13 to 15 and 21 to 24 weeks of age (Sidak’s multiple comparison post-tests, * p < 0.05 at 6 weeks, 13 to 15 weeks, and 21 to 24 weeks). (D) Relative liver Cyp3a11 abundance was not decreased on a high-fat diet. mRNA abundance was determined by digital droplet quantitative PCR and normalized to Nono. Transcript levels did not differ significantly between chow and high-fat diet fat groups (p > 0.05 by t test). (E) Relative liver Cyp27a1 abundance was not decreased on a high-fat diet. mRNA abundance was determined by digital droplet quantitative PCR and normalized to Nono. Transcript levels did not differ significantly between chow and high-fat diet fat groups (p > 0.05 by t test). (F) Relative liver Cyp24a1 abundance was not decreased on a high-fat diet. mRNA abundance was determined by digital droplet quantitative PCR and normalized to Nono. Transcript levels did not differ significantly between chow and high-fat diet fat groups (p > 0.05 by t test).
Fig. 2
Fig. 2
(A) Ratio of 25(OH)D3 to cholecalciferol is increased in lean mice relative to obese mice. The ratio of 25(OH)D to cholecalciferols is increased in lean mice relative to obese mice (n ≥ 3 for each group, all mice 21 to 24 weeks of age, *** p < 0.001 by t test). (B) The ratio of 25(OH) D3 to cholecalciferol correlates with liver Cyp2r1 mRNA abundance. Ratio = –0.1828 + 0.7166* CYP2R1, R2 = 0.858 (n ≥ 3 for each group, all mice 21 to 24 weeks of age, *** p < 0.001 by t test). Red = obese mice on high fat diet; Blue = lean mice on CHOW diet.
Fig. 3
Fig. 3
Lean mice have significantly increased hepatic 25-hydroxylase activity relative to obese mice. The ex vivo liver 25-hydroxylase activity of 13-week-old lean mice is greater than that in obese mice (1.8 ± 0.4 ng/ mL/g liver in assay versus 0.6 ± 0.2, n = 5 for each group, all mice 13 weeks of age, * p < 0.05 by t test).
Fig. 4
Fig. 4
Liver Cyp2r1 protein abundance is decreased with on high-fat diet. (A) Representative Western blot of two diet groups, chow and high fat (n = 4). (B) Quantitation of Cyp2r1 liver protein reveals Cyp2r1 expression is decreased on a high-fat diet at 13 weeks old (t test, p = 0.00978).
Fig. 5
Fig. 5
Obese mice orally gavaged with calcidiol have significantly increased serum 25(OH)D3 compared to obese mice gavaged with cholecalciferol. Serum 25(OH)D3 was significantly increased in the calcidiol group (20.6 ng/mL) compared to the cholecalciferol group (37.17 ng/mL) 3 days following gavage (p = 0.0002, t test).

Comment in

  • Obesity and Vitamin D Metabolism Modifications.
    Landrier JF, Mounien L, Tourniaire F. Landrier JF, et al. J Bone Miner Res. 2019 Jul;34(7):1383. doi: 10.1002/jbmr.3739. Epub 2019 May 29. J Bone Miner Res. 2019. PMID: 31141222 No abstract available.

References

    1. Ahn J, Yu K, Stolzenberg-Solomon R, et al. Genome-wide association study of circulating vitamin D levels. Hum Mol Genet 2010;19(13): 2739–45. - PMC - PubMed
    1. Wang TJ, Zhang F, Richards JB, et al. Common genetic determinants of vitamin D insufficiency: a genome-wide association study. Lancet 2010;376(9736):180–8. - PMC - PubMed
    1. Anderson D, Holt BJ, Pennell CE, Holt PG, Hart PH, Blackwell JM. Genome-wide association study of vitamin D levels in children: replication in the Western Australian Pregnancy Cohort (Raine) study. Genes Immun 2014;15(8):578–83. - PubMed
    1. Cheng JB, Levine MA, Bell NH, Mangelsdorf DJ, Russell DW. Genetic evidence that the human CYP2R1 enzyme is a key vitamin D 25-hydroxylase. Proc Natl Acad Sci U S A 2004;101(20):7711–5. - PMC - PubMed
    1. Samuel L, Borrell LN. The effect of body mass index on optimal vitamin D status in U.S. adults: the National Health and Nutrition Examination Survey 2001–2006. Ann Epidemiol 2013;23(7):409–14. - PubMed

Publication types