

Proteome profiling of triple negative breast cancer cells overexpressing NOD1 and NOD2 receptors unveils molecular signatures of malignant cell proliferation
- PMID: 30791886
- PMCID: PMC6385390
- DOI: 10.1186/s12864-019-5523-6
Proteome profiling of triple negative breast cancer cells overexpressing NOD1 and NOD2 receptors unveils molecular signatures of malignant cell proliferation
Abstract
Background: Triple negative breast cancer (TNBC) is a malignancy with very poor prognosis, due to its aggressive clinical characteristics and lack of response to receptor-targeted drug therapy. In TNBC, immune-related pathways are typically upregulated and may be associated with a better prognosis of the disease, encouraging the pursuit for immunotherapeutic options. A number of immune-related molecules have already been associated to the onset and progression of breast cancer, including NOD1 and NOD2, innate immune receptors of bacterial-derived components which activate pro-inflammatory and survival pathways. In the context of TNBC, overexpression of either NOD1or NOD2 is shown to reduce cell proliferation and increase clonogenic potential in vitro. To further investigate the pathways linking NOD1 and NOD2 signaling to tumorigenesis in TNBC, we undertook a global proteome profiling of TNBC-derived cells ectopically expressing each one of these NOD receptors.
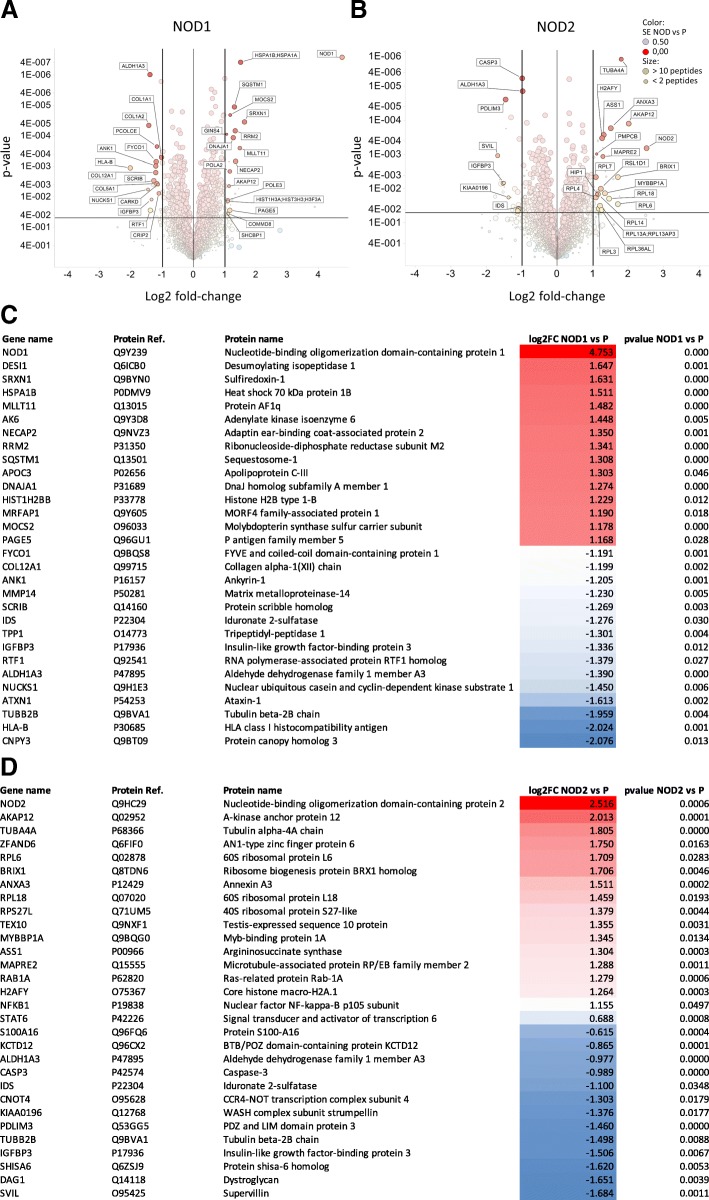
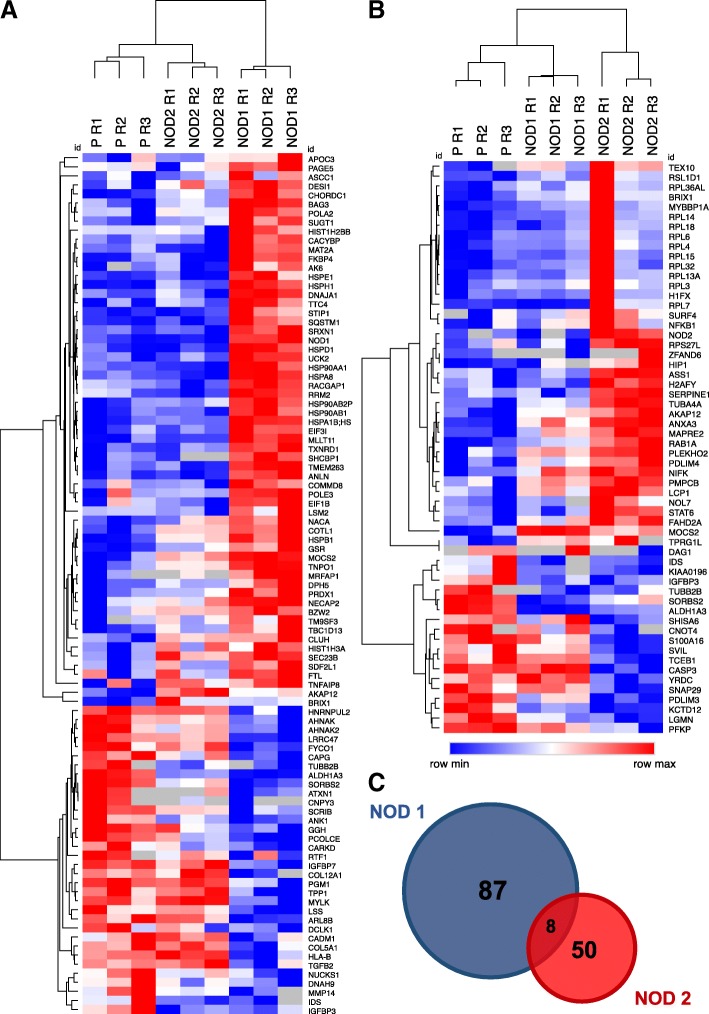
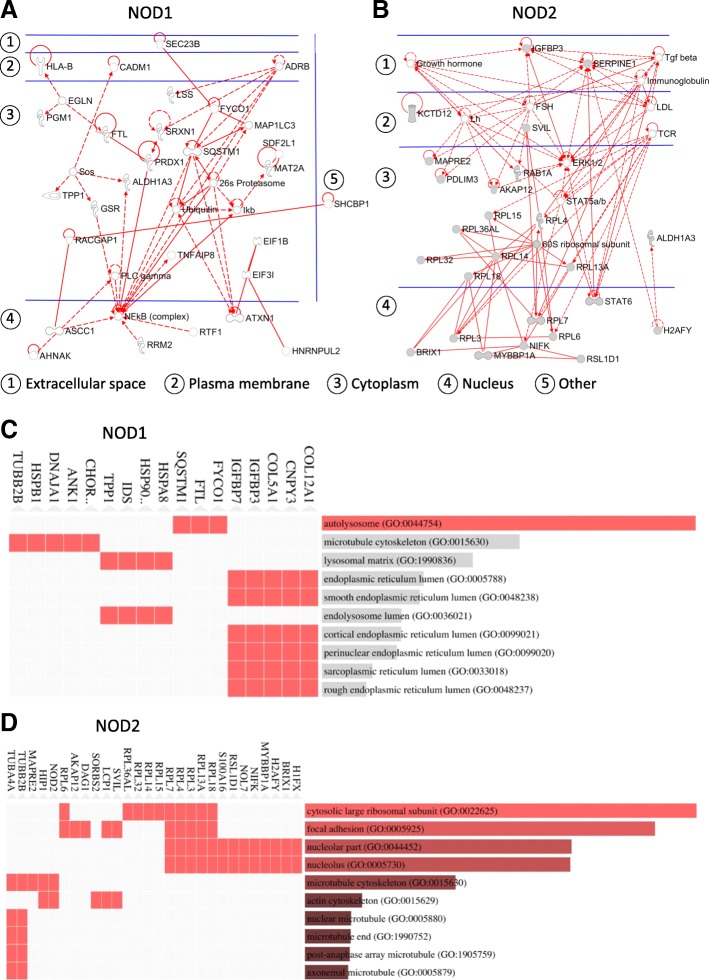
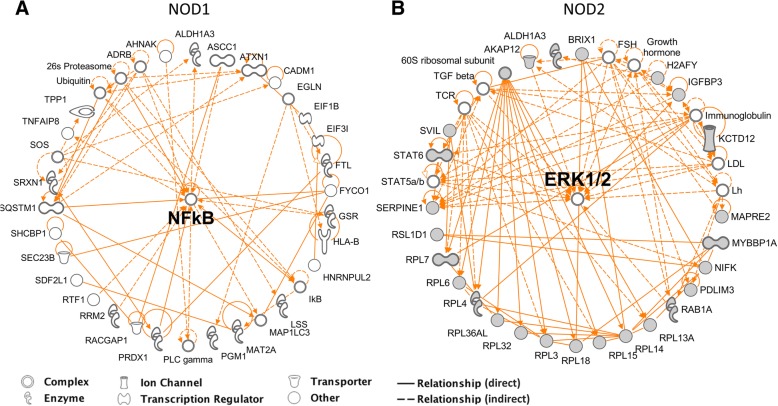
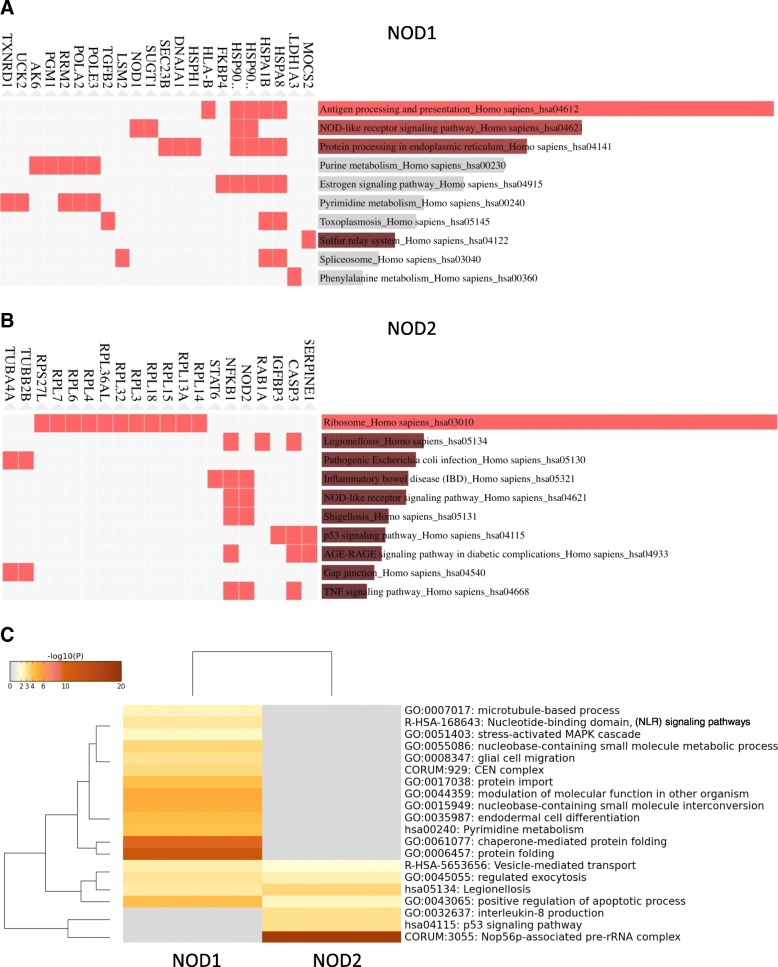
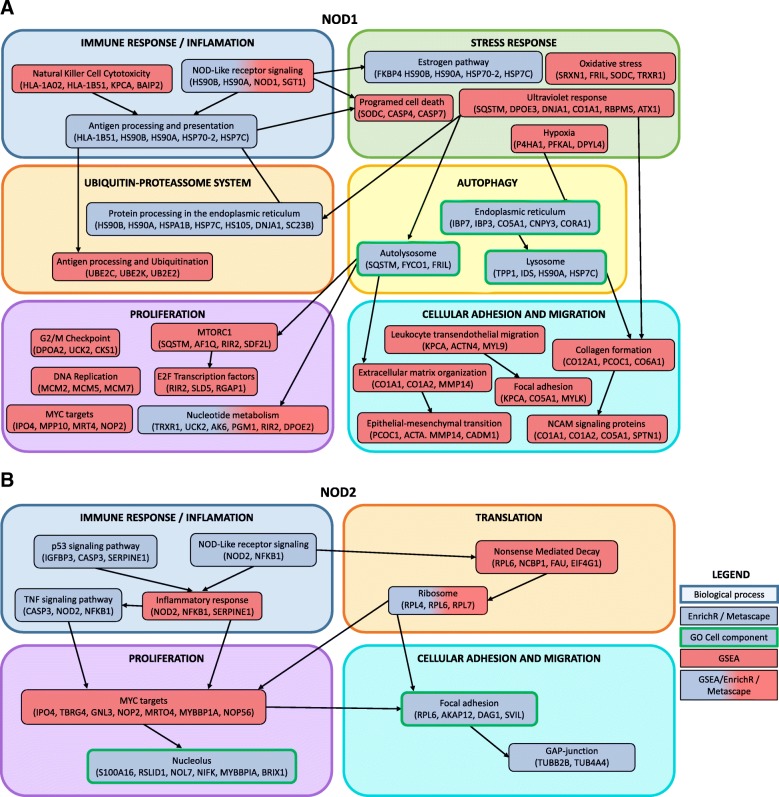
Results: We have identified a total of 95 and 58 differentially regulated proteins in NOD1- and NOD2-overexpressing cells, respectively. We used bioinformatics analyses to identify enriched molecular signatures aiming to integrate the differentially regulated proteins into functional networks. These analyses suggest that overexpression of both NOD1 and NOD2 may disrupt immune-related pathways, particularly NF-κB and MAPK signaling cascades. Moreover, overexpression of either of these receptors may affect several stress response and protein degradation systems, such as autophagy and the ubiquitin-proteasome complex. Interestingly, the levels of several proteins associated to cellular adhesion and migration were also affected in these NOD-overexpressing cells.
Conclusions: Our proteomic analyses shed new light on the molecular pathways that may be modulating tumorigenesis via NOD1 and NOD2 signaling in TNBC. Up- and downregulation of several proteins associated to inflammation and stress response pathways may promote activation of protein degradation systems, as well as modulate cell-cycle and cellular adhesion proteins. Altogether, these signals seem to be modulating cellular proliferation and migration via NF-κB, PI3K/Akt/mTOR and MAPK signaling pathways. Further investigation of altered proteins in these pathways may provide more insights on relevant targets, possibly enabling the immunomodulation of tumorigenesis in the aggressive TNBC phenotype.
Keywords: Hs578T; MAPK triple negative breast cancer; NF-κB; NLR; NOD1; NOD2; Proteome.
Conflict of interest statement
Ethics approval and consent to participate
Not applicable.
Consent for publication
Not applicable.
Competing interests
The authors declare that they have no competing interests.
Publisher’s Note
Springer Nature remains neutral with regard to jurisdictional claims in published maps and institutional affiliations.
Figures
Similar articles
-
Expression and in vitro assessment of tumorigenicity for NOD1 and NOD2 receptors in breast cancer cell lines.BMC Res Notes. 2018 Apr 3;11(1):222. doi: 10.1186/s13104-018-3335-4. BMC Res Notes. 2018. PMID: 29615116 Free PMC article.
-
Upregulation of NOD1 and NOD2 contribute to cancer progression through the positive regulation of tumorigenicity and metastasis in human squamous cervical cancer.BMC Med. 2022 Feb 8;20(1):55. doi: 10.1186/s12916-022-02248-w. BMC Med. 2022. PMID: 35130902 Free PMC article.
-
Molecular characterization, expression and functional analysis of NOD1, NOD2 and NLRC3 in Nile tilapia (Oreochromis niloticus).Fish Shellfish Immunol. 2018 Feb;73:207-219. doi: 10.1016/j.fsi.2017.12.012. Epub 2017 Dec 11. Fish Shellfish Immunol. 2018. PMID: 29242132
-
NOD1 and NOD2 Are Potential Therapeutic Targets for Cancer Immunotherapy.Comput Intell Neurosci. 2022 Oct 10;2022:2271788. doi: 10.1155/2022/2271788. eCollection 2022. Comput Intell Neurosci. 2022. Retraction in: Comput Intell Neurosci. 2023 Aug 9;2023:9847813. doi: 10.1155/2023/9847813. PMID: 36262606 Free PMC article. Retracted. Review.
-
The Nodosome: Nod1 and Nod2 control bacterial infections and inflammation.Semin Immunopathol. 2007 Sep;29(3):289-301. doi: 10.1007/s00281-007-0083-2. Epub 2007 Aug 10. Semin Immunopathol. 2007. PMID: 17690884 Review.
Cited by
-
NOD1-Targeted Immunonutrition Approaches: On the Way from Disease to Health.Biomedicines. 2021 May 6;9(5):519. doi: 10.3390/biomedicines9050519. Biomedicines. 2021. PMID: 34066406 Free PMC article. Review.
-
Classification of Breast Cancer Nottingham Prognostic Index Using High-Dimensional Embedding and Residual Neural Network.Cancers (Basel). 2022 Feb 13;14(4):934. doi: 10.3390/cancers14040934. Cancers (Basel). 2022. PMID: 35205681 Free PMC article.
-
Nucleotide-Binding Oligomerization Domain (NOD)-Like Receptor Subfamily C (NLRC) as a Prognostic Biomarker for Glioblastoma Multiforme Linked to Tumor Microenvironment: A Bioinformatics, Immunohistochemistry, and Machine Learning-Based Study.J Inflamm Res. 2023 Feb 10;16:523-537. doi: 10.2147/JIR.S397305. eCollection 2023. J Inflamm Res. 2023. PMID: 36798872 Free PMC article.
-
Therapeutic potential of a novel prodrug of green tea extract in induction of apoptosis via ERK/JNK and Akt signaling pathway in human endometrial cancer.BMC Cancer. 2020 Oct 6;20(1):964. doi: 10.1186/s12885-020-07455-3. BMC Cancer. 2020. PMID: 33023525 Free PMC article.
-
Innate immunity gene Nod2 protects mice from orthotopic breast cancer.Mol Biol Rep. 2024 Sep 17;51(1):988. doi: 10.1007/s11033-024-09927-2. Mol Biol Rep. 2024. PMID: 39285089 Free PMC article.
References
-
- IARC. World Cancer report 2014: World Health Organization; 2014. http://publications.iarc.fr/Non-Series-Publications/World-Cancer-Reports...
MeSH terms
Substances
LinkOut - more resources
Full Text Sources
Miscellaneous
