. 2019 Apr 3;102(1):202-216.e7.
doi: 10.1016/j.neuron.2019.01.036. Epub 2019 Feb 18.

Somatostatin-Expressing Interneurons Enable and Maintain Learning-Dependent Sequential Activation of Pyramidal Neurons

Affiliations

Somatostatin-Expressing Interneurons Enable and Maintain Learning-Dependent Sequential Activation of Pyramidal Neurons

Avital Adler et al. Neuron. .

Abstract

The activities of neuronal populations exhibit temporal sequences that are thought to mediate spatial navigation, cognitive processing, and motor actions. The mechanisms underlying the generation and maintenance of sequential neuronal activity remain unclear. We found that layer 2 and/or 3 pyramidal neurons (PNs) showed sequential activation in the mouse primary motor cortex during motor skill learning. Concomitantly, the activity of somatostatin (SST)-expressing interneurons increased and decreased in a task-specific manner. Activating SST interneurons during motor training, either directly or via inhibiting vasoactive-intestinal-peptide-expressing interneurons, prevented learning-induced sequential activities of PNs and behavioral improvement. Conversely, inactivating SST interneurons during the learning of a new motor task reversed sequential activities and behavioral improvement that occurred during a previous task. Furthermore, the control of SST interneurons over sequential activation of PNs required CaMKII-dependent synaptic plasticity. These findings indicate that SST interneurons enable and maintain synaptic plasticity-dependent sequential activation of PNs during motor skill learning.

Keywords: CaMKII plasticity; interneurons; motor skill learning; somatostatin; temporal sequences.


Conflict of interest statement

Declaration of Interests

The authors declare no competing interests.

Figures

Figure 1.
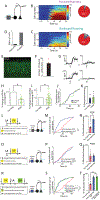
Figure 1.. Motor learning induces temporal reorganization in the population activity of L2/3 PNs
A. Left: Schematic of Ca2+ imaging of L2/3 PNs during treadmill training. Right: image of GCaMP6s-expressing L2/3 PNs. Yellow and cyan: cells depicted in E and F. B. Percentage of different FR gait patterns pre- and post-training. 24 mice. C. Percent of structured running increases after training (P< 0.0001; 24 mice). D. Distance between animal’s front paws (stride width) during structured running decreases after training (P<0.0001; 24 mice). E-F. Running related activity of two PNs (left and right columns) before (E) and after (F) training. 4 individual trials (color) and average ΔF/F ± s.e.m (black and gray) are shown (Arrow: treadmill on). Bottom row in (F): average activity during pre- (pink) and post-training (blue) zoomed on the peak (Arrows: time differences between peaks). Scale bars: 10s and 100% ΔF/F. G-J. Maximum-normalized average activity to FR from all neurons (rows) imaged from a single animal pre- (G) and post- (H) training, and from multiple animals (508 cells, 17 animals) pre- (I) and post-training (J). Time zero: treadmill on. Cells are ordered according to the time of their peak responses. K. Cumulative sum of the time of the peak activity of the neurons in (I) and (J), P<0.0001. L. Peak activity time of PNs from (I) (x-axis) and (J) (y-axis). Each dot represents one PN. PNs peaked earlier in the running trial following training (P<0.0001). M. Activity onset time of PNs from (I) (x-axis) and (J) (y-axis). Response onset occurred earlier post-training, P<0.0001. N. The amplitude (ΔF/F) of the peak activity of PNs was not different before (x-axis) and after training (y-axis), P=0.13. O. Cumulative sum of the time of the peak activity of PNs before (dashed red/purple) and after 20-minute (dashed blue/light blue) FR in naive mice or in mice after extensive training respectively (508 cells, 17 mice and 111 cells, 5 mice). Pre-training peak activity time is significantly different from all other groups (P<0.0001). After extensive training there is no longer a temporal shift in the population sequential activity. P. Following extensive training the correlation between the ranks of the neurons pre- and post- FR training (0.33, red line) is significantly higher compared with random shuffling (P<0.001). 111 cells, 5 mice. Q. The sequential activity profile and structured running are correlated (P<0.001). Each black dot represents the median of the times of peak activity of PNs vs. the percentage of structured running for a single running trial. The median is taken as a measure of the pattern of the sequential activity of PNs, i.e. amount of shift towards movement onset. 38 trials, 4 mice. R. Similar as in (Q) except for wobble gait pattern. Sequential activity profile and wobble gait pattern are not correlated (P=0.056). Statistical results are in Table S1. See also Figures S1, S2 and S8
Figure 2.
Figure 2.. SST INs exhibit diverse and task specific responses to motor learning
A. Schematic of Ca2+ imaging of L2/3 SST INs in M1. B. Left: image of SST INs expressing GCaMP6m before and after FR. Right: FR induced changes in ΔF/F. Arrow: treadmill on. Top 4 traces: ΔF/F of cells on the left; bottom: average ± s.e.m (gray envelope). Scale bar: 100% ΔF/F and 10s. C-D. Distribution of the average and peak baseline activity of SST INs (150 cells, 21 mice). E. Average activity of SST INs (rows) in response to FR (150 cells, 21 mice). Baseline activity was subtracted from the average activity traces. Time zero: treadmill on. F. Population average response ± s.e.m (gray envelope) of all SST INs with significantly reduced (left) or increased (right) activity to FR. G. Percentages of SST INs with significantly decreased (blue) or increased (red) activity or no change (gray) during FR. H-J. Similar to E-G, but during BR. Cells are reordered according to their BR response profiles. 150 cells, 21 mice. K-M. Examples of SST IN responses to FR and BR averaged over 5 trials ± s.e.m (gray envelope). Responses to FR and BR are significantly different (P=0.049, 0.0056 and 0.006 for K, L and M). N. Ratio of SST INs (out of all INs with significantly different responses to FR and BR, which constitute 50% of the cells) with opposite or similar response profile directions to FR and BR. Statistical results are in Table S1. See also Figure S3
Figure 3.
Figure 3.. Activation of SST INs blocks the temporal shift in sequential activation of L2/3 PNs and behavioral improvement
A. Images of SST INs infected with DREADD Gi in M1. Image on the right: enlarged rectangle area. B. Number of SST INs infected with DREADD in the densest 1 mm2 area. 6 mice. C. Images of L2/3 SST INs expressing both GCaMP6m (green) and hM3D(Gq)-mCherry (red). D. Schematic of Ca2+ imaging of SST INs infected with DREADD Gq. E. Two examples of SST IN activity to FR (arrow: treadmill on) before (left) and after (right) CNO administration in mice infected with DREADD Gq. Gray lines: single trials; black line: average. F. The level of SST IN activity (ΔF/F) during FR is higher following CNO administration in mice infected with DREADD Gq (P<0.0001). 26 cells from 2 mice. G-I. Similar as in D-F only for animals infected with DREADD Gi. (I): The level of SST IN activity is lower following CNO administration (P<0.01). 13 cells from 3 mice. J. Schematic of Ca2+ imaging of PNs in SST Cre mice infected with DREADD Gq or Gi and injected with saline. K. Maximum-normalized average activity of PNs pre- (left) and post- (right) training. L. Cumulative sum of the time of the peak activity of PNs in (K). Post training saturates faster (P<0.0001). M. Peak activity time of PNs (dots) from (K) pre- (x-axis) and post-training (y-axis). PNs peaked earlier following saline injection and FR training (P<0.0001). N. Percent structured running is higher post-training (P<0.001; 16 mice). O-S. Similar to J-N, except that mice were infected with DREADD Gq and received CNO. PR: 174 cells, 6 mice; (S): 8 mice. Peak activity timing did not shift (P=0.18, P=0.85 for Q and R). Mice did not display behavioral improvements (P=0.97 for S). T-X. Similar to J-N, except that mice were infected with DREADD Gi and received CNO. UW: 140 cells, 4 mice; (X): 10 mice. Peak activity timing shifted toward treadmill on (P<0.0001, P<0.0001 for V and W). Mice displayed behavioral improvements (P=0.015 for X). Statistical results are in Table S1. See also Figures S4 and S5
Figure 4.
Figure 4.. Inhibiting SST INs during new learning de-stabilizes previous learning-dependent sequential activity of PNs
A. Training protocol to test the role of SST IN inhibition in stabilizing sequential activation of PNs. B. Schematic of Ca2+ imaging of PNs in SST Cre mice infected with DREADD Gi and receiving saline prior to BR training. C-E. Maximum-normalized average activity to FR from all PNs before (C), after 20 minutes FR training (D) and after saline injection/20 minutes BR training (E). 123 cells, 5 mice. F. Cumulative sum of the time of the peak activity of PNs from (C), (D) and (E). Changes in sequential activity are maintained. P<0.0001 (C and D); P=0.01 (C and E); P=0.13 (D and E). G. Peak activity time of single PNs (dots) is delayed before (x-axis) compared with after FR training (y-axis) (P<0.001). H. Peak activity time of single PNs (dots) after FR training (x-axis) is comparable with after BR training following saline administration (y-axis). I. Behavioral improvement is maintained after BR training. (P=0.002; 8 mice). J-Q. Similar to B-I, except that mice were infected with DREADD Gi and received CNO before BR training. K-P: 120 cells, 5 mice; (Q): 8 mice. Leftward shift in temporal sequence (P<0.001 (K and L), P<0.01 (K and M), P<0.0001 (L and M)) and behavioral improvement (P<0.001) are reversed. R-Y. Similar to B-I, except that mice were infected with DREADD Gi and received CNO before the second FR training. S-X: 70 cells, 4 mice; (Y): 8 mice. Leftward shift in temporal sequence (P<0.0001 (S and T), P<0.0001 (S and U), P=0.72 (T and U)) and behavioral improvement (P<0.001) are maintained. Statistical results are in Table S1. See also Figures S4 and S5
Figure 5.
Figure 5.. Increased activity of VIP INs is required for establishing, but not for maintaining, learning-induced sequential activation of PNs
A. Schematic of Ca2+ imaging of VIP INs in VIP Cre mice infected with PSAM in M1. B. Left: average activity of VIP INs to FR pooled across 74 cells from 12 mice. Baseline activity was subtracted from average activity traces. Time zero: treadmill on. Right: percentages of VIP INs with significantly decreased (blue) or increased (red) activity or no change (gray) during FR. C. Similar as in (B) except during BR (74 cells, 12 mice). D. Ratio of VIP INs (out of all INs with significantly different responses to FR and BR, which constitute 60.3% of the cells) with opposite or similar response profile directions to FR and BR. E. Image of VIP INs infected with PSAM in M1. F. Number of VIP INs infected with PSAM in the densest 1 mm2 area. 6 mice. G. Two examples of VIP IN activity to FR (arrow: treadmill on) before (left) and after (right) PSEM308 administration. Gray lines: single trials; black line: average. H. The level of VIP IN activity (ΔF/F) following PSEM308 administration is lower (P<0.0001; 3 mice, 40 cells). I. The level of PNs activity (ΔF/F) following PSEM308 administration is lower (P<0.001; 3 mice, 89 cells). J. Peak activity time of PNs is not significantly different before and following PSEM308 administration (P=0.1; 3 mice, 89 cells). K. Percent structure running is not significantly different before and following PSEM308 administration (P=0.69; 8 mice). L. Left: training protocol to test the effect of ACSF administration on learning-induced sequential activity. Right: schematic of Ca2+ imaging of PNs in VIP Cre mice infected with PSAM and receiving ACSF locally in M1. M. Cumulative sum of the time of the peak activity of PNs pre- (red) and post-training (blue). Post-training saturates faster (P<0.0001; 170 cells, 4 mice). N. Percent structure running is significantly higher post-training (P<0.001; 7 mice). O-Q Similar as in (L-N) except that mice were administered PSEM308. Peak activity time of PNs (P, 204 cells, 4 mice) and percent structured running (Q, 8 mice) are not significantly different pre- and post-training (P=0.08 and P=0.97) R. Left: training protocol to test the function of VIP IN inhibition in the stabilization of the sequential activation of PNs. Right: schematic of Ca2+ imaging of PNs in VIP Cre mice infected with PSAM and receiving PSEM308. S. Cumulative sum of the time of the peak activity of PNs pre- and post- FR training and after PSEM308 administration/BR training. Changes in sequential activity are maintained. P<0.0001 (pre- and post training); P=0.13 (post-training: FW and BW PSEM); 131 cells, 4 mice. T. Percent structured running pre-, post- FR training and after BR training following PSEM308 administration. 8 mice. Behavioral improvement maintained after BR training (P<0.001). Statistical results are in Table S1.
Figure 6.
Figure 6.. Inhibiting SST INs during new motor learning reverses previous learning-induced changes in spine Ca2+ activity of PNs
A. Images of PN dendrite expressing GCaMP6s during FR at two individual time points (t1 and t2). Boxed area is enlarged on the left of each image. Left: single spine is active, right: Ca2+ activity occurs along dendritic shaft invading all spines. Arrow heads: spines with activity traces in B. B. Individual traces for spines (color) and shaft (black) showing changes in ΔF/F in response to FR. C. Spine activity after removing contributions of Ca2+ signal due to back-propagating action potentials. D. Peak Ca2+ activity of PN dendritic spines pre- and post- FR training. 155 spines, 19 mice. Spine Ca2+ activity following FR training is significantly different compared with before (P<0.05). Inset: population average spine activity (ΔF/F) pre- and post-training (P<0.0001). Population average was taken over spines for which the normalized activity following FR training was equal to or higher than before training. E. Schematic of Ca2+ imaging of dendritic spines in SST Cre mice infected with DREADD Gq and injected with CNO. F. Similar as in (D), except that mice infected with DREADD Gq received CNO prior to FR training. 39 spines, 6 mice. Spine Ca2+ activity is comparable before and after FR training (P=0.5). G. Training protocol to examine stabilization of spine Ca2+ activity changes with or without reducing SST IN activity. H. Schematic of Ca2+ imaging of dendritic spines in SST Cre mice infected with DREADD Gi and injected with saline. I. Peak Ca2+ activity of dendritic spines to FR: before training, following 20 minutes FR training and following saline injection and 20 minutes BR training. 40 spines, 8 mice. Changes in synaptic activity following FR training are maintained following BR training (P<0.001). J. Schematic of Ca2+ imaging of dendritic spines in SST Cre mice infected with DREADD Gi and injected with CNO. K. Similar as in (I), except that animals received CNO before BR training. 37 spines, 9 mice. Changes in spine Ca2+ activity following FR training are reversed following BR training (P<0.01). L. Similar as in (I), except that animals received CNO before additional FR training. 45 spines, 5 mice. Changes in spine Ca2+ activity following FR training are maintained following second FR training. (P<0.01). Statistical results are in Table S1. See also Figure S6
Figure 7.
Figure 7.. Pharmacological blocking of CaMKII activity prevents the establishment and destabilization of SST IN-dependent sequential activity of PNs
A. Training protocol to test the effect of blocking CaMKII on learning-induced sequential activity. B. Schematic of Ca2+ imaging of PNs after local application of CaMKII blockers. C. Peak activity timing shifted toward treadmill on with KN-92 infusion (P<0.0001; 114 cells, 4 mice). D. Percent structured running is significantly different pre- and post-training (P<0.0001; 7 mice). E. Similar as in (C) for KN-62 (left, 82 cells, 4 mice) or KN-93 (right, 87 cells, 4 mice). Pre- and post-training are not significantly different (P=0.42 and P=0.46 for KN-62 and KN-93). F. Similar as in (D) for KN-62 (left, 9 mice) or KN-93 (right, 7 mice). Pre- and post-training are not significantly different (P=0.74 and P=0.87 for KN-62 and KN-93). G. Training protocol to test the role of CaMKII in SST IN-dependent destabilization of sequential activity using KN-62. H. Schematic of Ca2+ imaging of PNs in SST Cre mice infected with DREADD Gi, injected with CNO and infused with KN-62. I. Maximum-normalized average activity to FR. Left: pre-training. Middle: post 20-minute FR training. Right: post CNO injection, KN-62 infusion and 20-minute BR training. 99 cells, 4 mice. J. Cumulative sum of peak activity time of PNs. Leftward shift is maintained. P<0.0001 (pre- and post training); P=0.13 (post-training: FW and BW/CNO/KN62). Statistical results are in Table S1. See also Figure S7
Figure 8.
Figure 8.. CaMKII-dependent synaptic plasticity is involved in SST IN-dependent temporal reorganization of PN activity
A. Images of L2/3 PNs expressing a light inducible CaMKII inhibitor (left) and red genetically encoded Ca2+ indicator RGECO (middle). B. Changes in RGECO fluorescence (ΔF/F) in response to FR from single cells (color). Arrow: treadmill on. Scale bars: 10s and 50% ΔF/F (cell 3 (green) scale bar: 100% ΔF/F). C. Training protocol to test the effect of blocking CaMKII with the light inducible CaMKII inhibitor. D. Schematic of Ca2+ imaging of PNs infected with the non-functional (control) light inducible CaMKII inhibitor. E. Peak activity timing shifted toward treadmill on following FR training (P<0.0001; 64 cells, 4 mice). F. Percent structured running is significantly higher after training (P<0.0001; 8 mice). G. Schematic of Ca2+ imaging of PNs infected with the light inducible CaMKII inhibitor. H. Similar as in (E) for active inhibitor. 118 cells, 6 mice. Pre-training is not significantly different from post-training (P=0.44). I. Similar as in (F) for active inhibitor. 8 mice. Pre-training is not significantly different from post-training (P=0.62). J. Training protocol to test the role of CaMKII in SST IN-dependent destabilization of sequential activity with the non-functional light inducible CaMKII inhibitor. K. Schematic of Ca2+ imaging of PNs in SST Cre mice infected with DREADD Gi in SST INs and control inhibitor in PNs. Mice were injected with CNO and received BR training under blue light. L. Maximum-normalized average activity to FR. 91 cells, 4 mice. Left; pre-training. Middle; post 20-minute FR training. Right; post CNO injection and 20-minute BR training with blue light illumination. M. Cumulative sum of the time of the peak activity of PNs. Changes in sequential activity are not maintained following BR with blue light illumination and CNO injection in the control mice. P<0.0001 (pre- and post-training/FW); P=0.15 (pre- and post-training/BW light/CNO); P<0.0001 (post training: FW and BW/light/CNO). N-Q. Similar as in J-M only for mice infected with active inhibitor. 97 cells, 5 mice. Changes in sequential activity are maintained following BR with blue light illumination and CNO injection. P<0.0001 (pre- and post-training/FW); P<0.0001 (pre- and post-training/BW light/CNO); P=0.42 (post training: FW and BW/light/CNO). Statistical results are in Table S1.

Comment in

References

    1. AMARI SI (1972). Learning Patterns and Pattern Sequences by Self-Organizing Nets of Threshold Elements. IEEE Transactions on Computers, C-21, 1197–1206.
    1. BELANGER M, DREW T, PROVENCHER J & ROSSIGNOL S (1996). A comparison of treadmill locomotion in adult cats before and after spinal transection. J Neurophysiol, 76, 471–91. - PubMed
    1. BI GQ & POO MM (1998). Synaptic modifications in cultured hippocampal neurons: dependence on spike timing, synaptic strength, and postsynaptic cell type. J Neurosci, 18, 10464–72. - PMC - PubMed
    1. BLUM KI & ABBOTT LF (1996). A model of spatial map formation in the hippocampus of the rat. Neural Comput, 8, 85–93. - PubMed
    1. BOLDING KA & FRANKS KM (2018). Recurrent cortical circuits implement concentration-invariant odor coding. Science, 361. - PMC - PubMed

Publication types

LinkOut - more resources