. 2019 Mar 4;216(3):704-720.
doi: 10.1084/jem.20180823. Epub 2019 Feb 21.

Human colon organoids reveal distinct physiologic and oncogenic Wnt responses

Affiliations

Human colon organoids reveal distinct physiologic and oncogenic Wnt responses

Birgitta E Michels et al. J Exp Med. .

Abstract

Constitutive Wnt activation upon loss of Adenoma polyposis coli (APC) acts as main driver of colorectal cancer (CRC). Targeting Wnt signaling has proven difficult because the pathway is crucial for homeostasis and stem cell renewal. To distinguish oncogenic from physiological Wnt activity, we have performed transcriptome and proteome profiling in isogenic human colon organoids. Culture in the presence or absence of exogenous ligand allowed us to discriminate receptor-mediated signaling from the effects of CRISPR/Cas9-induced APC loss. We could catalog two nonoverlapping molecular signatures that were stable at distinct levels of stimulation. Newly identified markers for normal stem/progenitor cells and adenomas were validated by immunohistochemistry and flow cytometry. We found that oncogenic Wnt signals are associated with good prognosis in tumors of the consensus molecular subtype 2 (CMS2). In contrast, receptor-mediated signaling was linked to CMS4 tumors and poor prognosis. Together, our data represent a valuable resource for biomarkers that allow more precise stratification of Wnt responses in CRC.


Figures

None
Graphical abstract
Figure 1.
Figure 1.
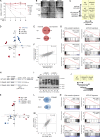
Differential profiling of receptor-induced and constitutive Wnt signaling. (A) Experimental approach for molecular profiling of CRISPR/Cas9 engineered human colon organoids. (B) Strategy for differential analysis of receptor-induced (extrinsic) and oncogene-induced (intrinsic) Wnt signaling. (C) Morphology of normal and APC-KO human colon organoids in control medium or 2 d after Wnt/R-spondin withdrawal. Arrowheads show differentiation of normal organoids. Scale bars are 200 µm. (D) qRT-PCR analysis of differentiation markers (blue) and Wnt/stem cell markers (red) in normal organoid lines 2 d after withdrawal of Wnt/R-spondin. Mean normalized expression (± SD in three technical replicates) is shown for all three organoid lines, and expression was measured twice independently. See also Fig. S1.
Figure 2.
Figure 2.
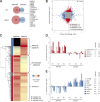
Transcriptomic changes after extrinsic and intrinsic Wnt modulation. (A) PCA shows that donor line–specific differences are the dominant source of gene expression variation. The 3,000 most variant genes were included for the analysis. (B) Differential gene expression analysis. Mean log twofold changes in n = 3 colon organoid lines (paired analysis). Significantly up- and down-regulated genes (±1 log twofold change; P adjust < 0.05) are marked in red and blue, respectively. (C and D) GSEA using previously reported human signatures for stem cells (C) and adenomas (D). Each signature was studied in the extrinsic and intrinsic Wnt response, and NESs and q values are shown. See also Fig. S2.
Figure 3.
Figure 3.
Distinct transcriptomic signatures induced by normal and oncogenic Wnt signaling. (A) Venn diagrams show limited overlap between significantly changed genes (± 1 log twofold change; P adjust < 0.05) after Wnt-receptor stimulation (extrinsic) and APC loss-of-function (intrinsic). Genes that are part of the mouse intestinal stem cell signature are underlined. (B) Global correlation shows independence of intrinsic and extrinsic responses. (C) Unsupervised clustering identifies specific APC-KO and Wnt-receptor signatures. Note that a number of adenoma genes are not expressed in WT cells (black). (D and E) qRT-PCR validation of identified marker genes. Genes induced after Wnt-receptor stimulation (D) and APC-KO–induced genes (E) are shown as mean normalized expression (± SD in three technical replicates). Significant responses in all three organoid lines were determined by Student’s t test and labeled as follows: one arrow, P < 0.05; two arrows, P < 0.01; three arrows, P < 0.001; n.s., not significant. Expression was measured twice independently. See also Table S1, A and B.
Figure 4.
Figure 4.
Wnt responses after modulation of the extrinsic (A–E) and intrinsic (H–N) signaling level. (A) Growth of normal colon organoids after titration of Wnt-conditioned medium. In each passage, the mean ATP level was measured (± SD; n = 3 technical replicates; donor #3). Splitting factor was 1:5. Experiment was repeated twice with similar results. (B) Morphological images of organoids after culture at different Wnt concentrations. Scale bar is 1 mm. (C) Strategy to study maximal and submaximal Wnt stimulation. (D) PCA shows dose-dependent changes in WT cells and separate clustering from APC-KO cells (n = 3 technical replicates each). (E and F) Venn diagrams of regulated transcripts (± 1 log twofold change; P adjust < 0.05; E) and global correlation of transcriptomic responses after maximal and submaximal Wnt stimulation (F). (G) GSEA shows incremental induction of the Wnt-receptor signature at distinct levels of receptor stimulation in WT cells. (H) Schematic representation of the APC protein and truncated variants containing three or two 20-aa repeat regions (20AAR, blue). The mutation cluster region (MCR) is indicated. (I) WB analysis of APC (and ACTIN for normalization) in whole-cell lysates of WT and CRISPR/Cas9 induced clonal lines (donor #3). Black and white arrowheads show WT and truncated proteins, respectively. High frequency of a single mutant allele and absence of WT allele was measured by ICE assay. WB and ICE analyses were repeated twice independently. (J) Strategy to study the influence of different APC truncations. (K) PCA shows separate clustering of normal and APC-KO organoids (n = 3 each). Stimulation was performed as in Fig. 1. (L and M) Similar intrinsic response by APC variants with two and three 20AARs. Venn diagrams of regulated transcripts (L; ± 0.5 log twofold change; P adjust < 0.05) and global correlation of changes (M). (N) GSEA shows similar induction of the APC-KO signature by both allelic variants.
Figure 5.
Figure 5.
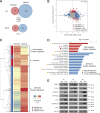
Proteomic changes after extrinsic and intrinsic Wnt modulation. (A) Number of identified proteins (represented by at least two peptides) in one, two, or three organoid lines. (B) Venn diagram shows overlap of identified proteins (present in at least two of three lines) and the data from Cristobal et al. (2017). (C) PCA of proteomic data. Note that the three lines cluster separately. (D) Pairwise differential expression analysis. Up- and down-regulated proteins (± 1 log twofold change; P < 0.25) are marked in red and blue. (E and F) GSEA shows that previous proteome signatures in mouse Lgr5+ stem cells (E) and human CRC organoids (F) cannot discriminate between extrinsic and extrinsic Wnt responses. See also Fig. S3.
Figure 6.
Figure 6.
Specific protein signatures for normal and oncogenic Wnt signaling. (A) Venn diagrams show limited overlap of proteins up- or down-regulated after Wnt-receptor (extrinsic) stimulation and APC loss-of-function (intrinsic). Proteins were filtered for log twofold changes ± 1 and P < 0.25. (B) Global correlation shows independence of intrinsic and extrinsic responses. (C) Unsupervised clustering of up-regulated proteins marks distinct Wnt-receptor and APC-KO signatures. (D) Ingenuity pathway analysis. Significantly enriched gene ontology terms for Wnt-receptor and APC-KO protein signature are shown (red and blue bars) that were further grouped into biological categories. (E) WB validation of proteins. Lysates from normal and APC-KO organoids (n = 3 isogenic pairs) cultured in the presence of Wnt/R-spondin were probed. ACTIN was used for normalization. See also Fig. S3 and Table S1, C and D.
Figure 7.
Figure 7.
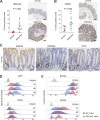
Validation of protein biomarkers for adenomas and normal stem cells. (A and B) Adenoma-specific expression of HMGCS2 (A) and CEMIP (B). Staining was performed on n = 6 normal tissues and n = 9–10 adenomas each. Expression was scored as percentage of strong pixels per total area, and mean percentage ± SD and P values (Student’s t test) are shown. Representative histological images of normal colon and adenoma tissue are shown next to each graph. Scale bars are 250 µm. (C) Immunodetection of AMACR, PPIP5K2, and the stem cell marker PTK7. Circles indicate increased expression at the bottom of colonic crypts. Scale bars are 100 µm. (D) FACS analysis shows increased surface expression of LRP1 and DPP4 in APC-KO cells (blue) compared with normal cells (red). Histogram plots in three isogenic organoid pairs that were cultured in Wnt/R-spondin containing medium. (E) Surface expression EPHA2 and BCAM shows reduced expression in APC-KO cells compared with normal cells. Experiments as in D. Stainings in A–E were independently reproduced at least twice. See also Fig. S4.
Figure 8.
Figure 8.
The Wnt-receptor signature is associated with poor prognosis and overlaps with CMS4 tumors. (A–D) Prognostic value of the APC-KO signature (A), the Wnt-receptor signature (B), and signatures for CMS2 (C) and CMS4 (D) tumors. Kaplan–Meier plots for relapse-free survival. For each signature, the expression cohort (GSE14333; 187 CRC cases; adjusted for age, gender, and stage) was divided into high expression (blue) and low expression (red) groups. Hazard ratios (HRs), 95% confidence intervals (CIs), and P values (log-rank test, multivariate analysis) are shown. (E) Pearson correlation of the individual tumor assignment to high/low expression groups in A–D. Note that CMS2/APC-KO signature and CMS4/Wnt-receptor signature mark two distinct groups of patients. (F and G) GSEA shows that CMS2 (F) and CMS4 genes (G) are strongly associated with the intrinsic and extrinsic Wnt responses in organoids, respectively. See also Fig. S5 and Table S5, A and B.

Similar articles

Cited by

References

    1. Acebron S.P., Karaulanov E., Berger B.S., Huang Y.-L., and Niehrs C.. 2014. Mitotic wnt signaling promotes protein stabilization and regulates cell size. Mol. Cell. 54:663–674. 10.1016/j.molcel.2014.04.014 - DOI - PubMed
    1. Aoki R., Shoshkes-Carmel M., Gao N., Shin S., May C.L., Golson M.L., Zahm A.M., Ray M., Wiser C.L., Wright C.V.E., and Kaestner K.H.. 2016. Foxl1-expressing mesenchymal cells constitute the intestinal stem cell niche. Cell. Mol. Gastroenterol. Hepatol. 2:175–188. 10.1016/j.jcmgh.2015.12.004 - DOI - PMC - PubMed
    1. Azzolin L., Panciera T., Soligo S., Enzo E., Bicciato S., Dupont S., Bresolin S., Frasson C., Basso G., Guzzardo V., et al. . 2014. YAP/TAZ incorporation in the β-catenin destruction complex orchestrates the Wnt response. Cell. 158:157–170. 10.1016/j.cell.2014.06.013 - DOI - PubMed
    1. Barker N., van Es J.H., Kuipers J., Kujala P., van den Born M., Cozijnsen M., Haegebarth A., Korving J., Begthel H., Peters P.J., and Clevers H.. 2007. Identification of stem cells in small intestine and colon by marker gene Lgr5. Nature. 449:1003–1007. 10.1038/nature06196 - DOI - PubMed
    1. Billmann M., Chaudhary V., ElMaghraby M.F., Fischer B., and Boutros M.. 2018. Widespread rewiring of genetic networks upon cancer signaling pathway activation. Cell Syst. 6:52–64.e4. 10.1016/j.cels.2017.10.015 - DOI - PMC - PubMed

Publication types

MeSH terms

Substances