

New thiazolidinones reduce iron overload in mouse models of hereditary hemochromatosis and β-thalassemia
- PMID: 30792208
- PMCID: PMC6717595
- DOI: 10.3324/haematol.2018.209874
New thiazolidinones reduce iron overload in mouse models of hereditary hemochromatosis and β-thalassemia
Abstract
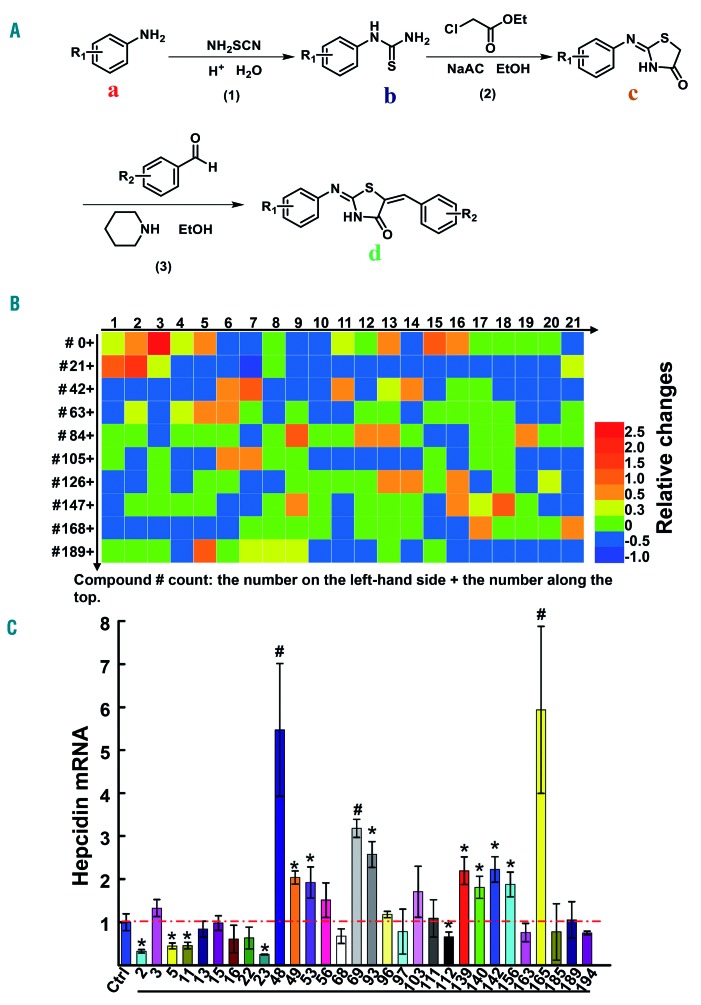
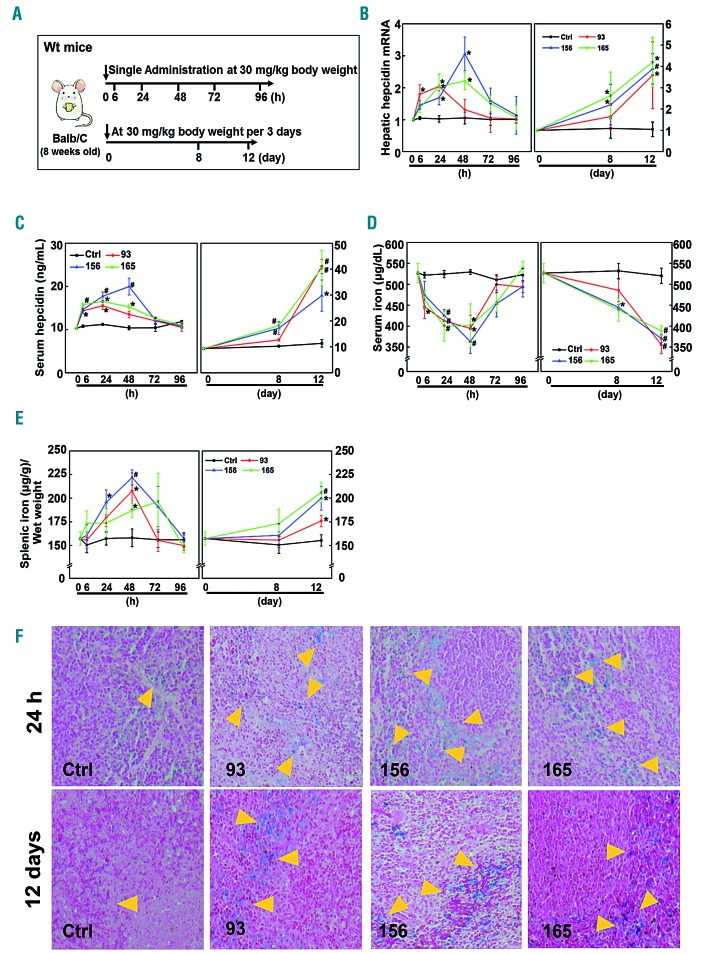
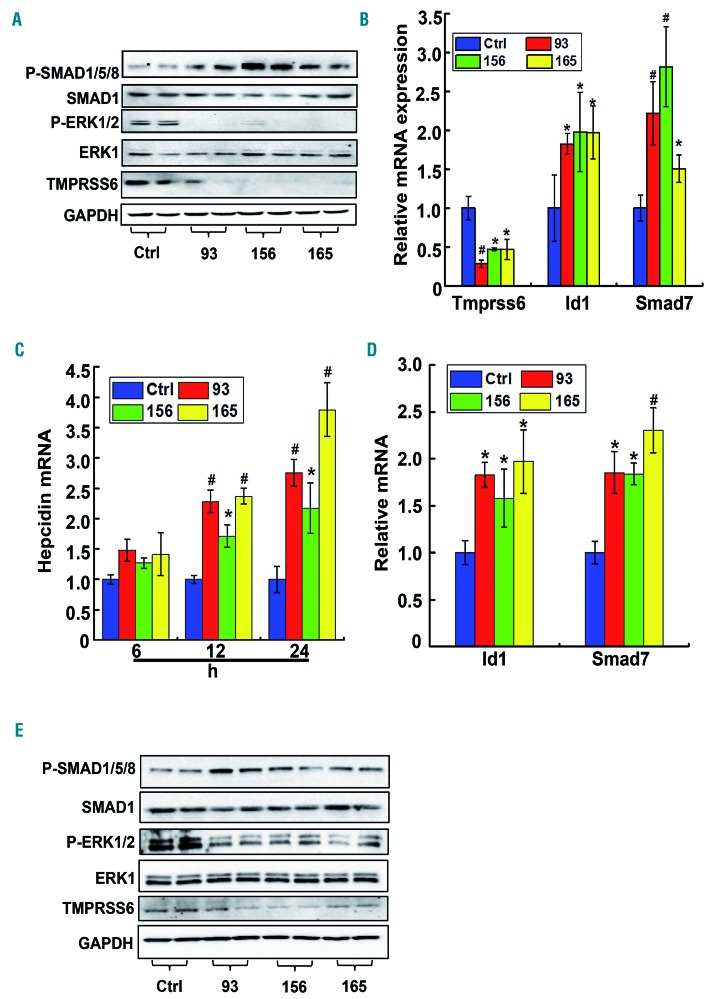
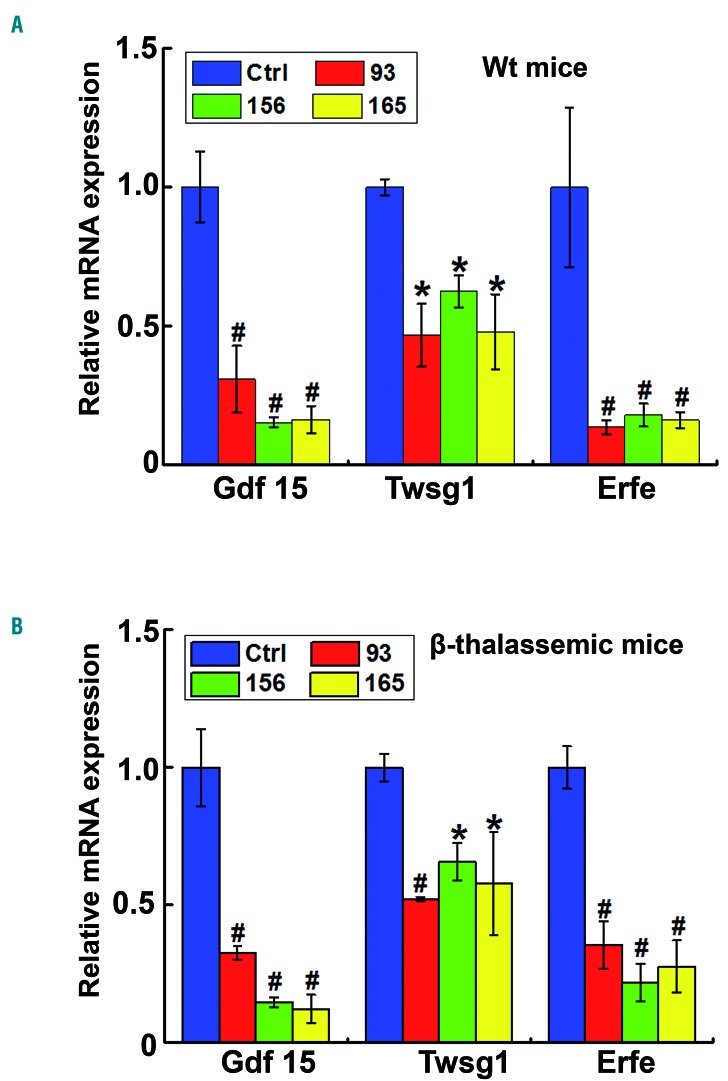
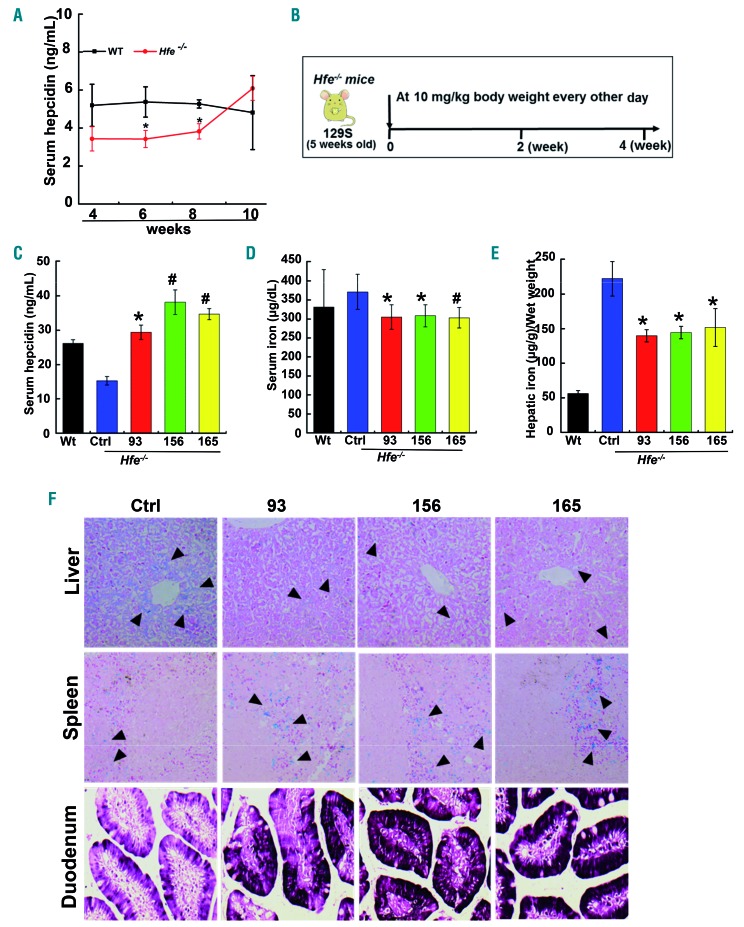
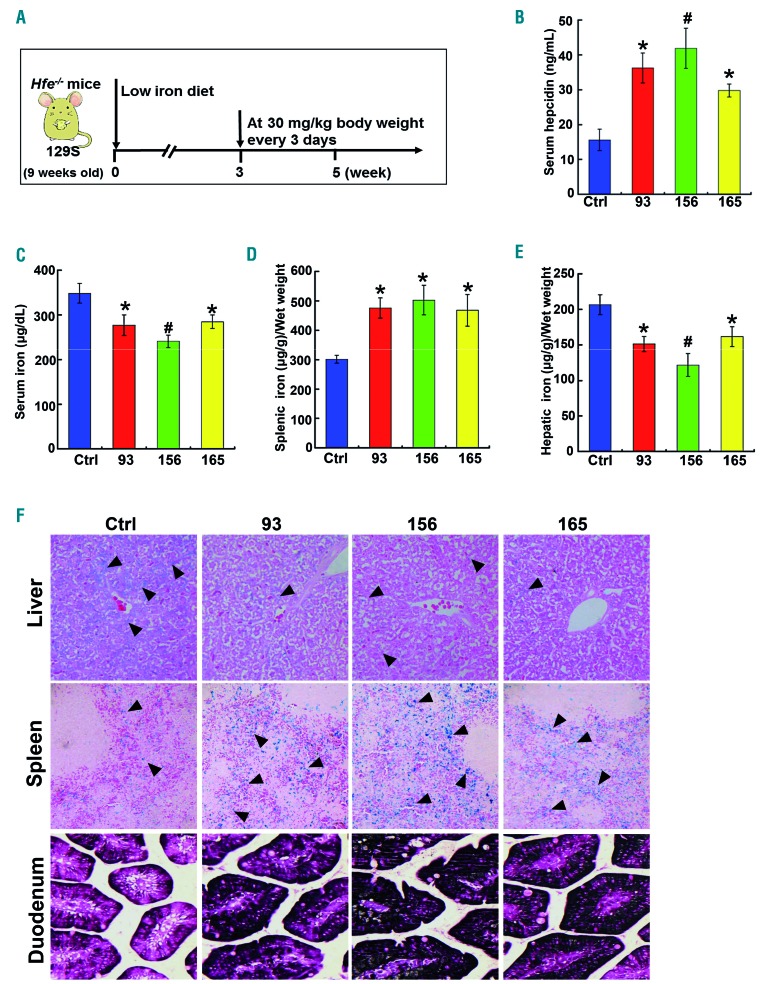
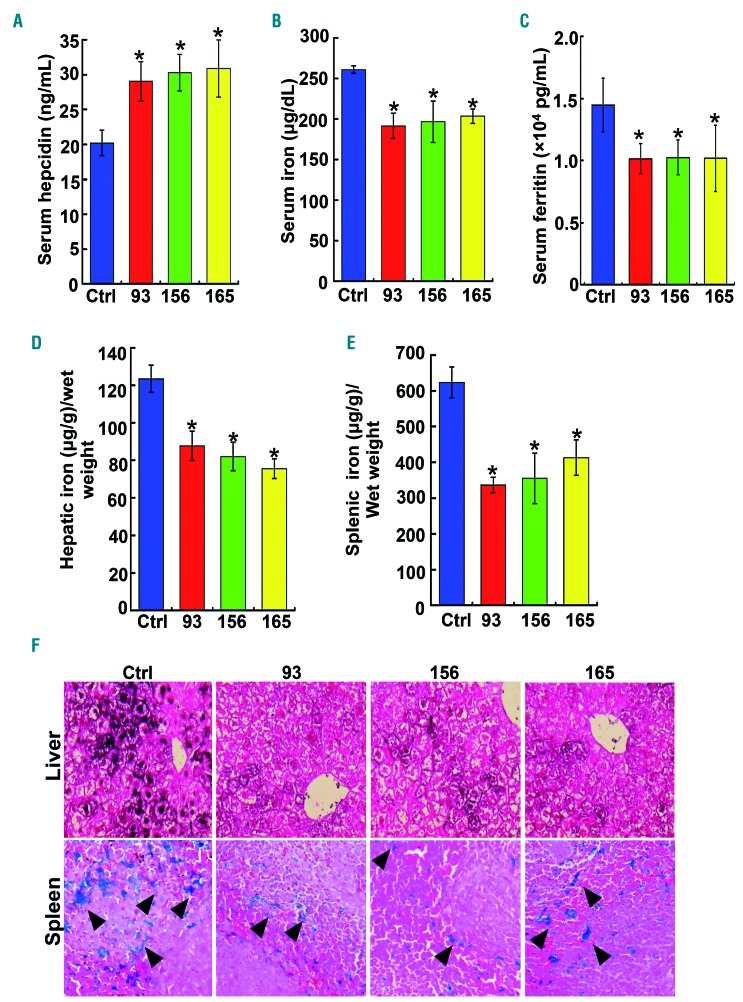
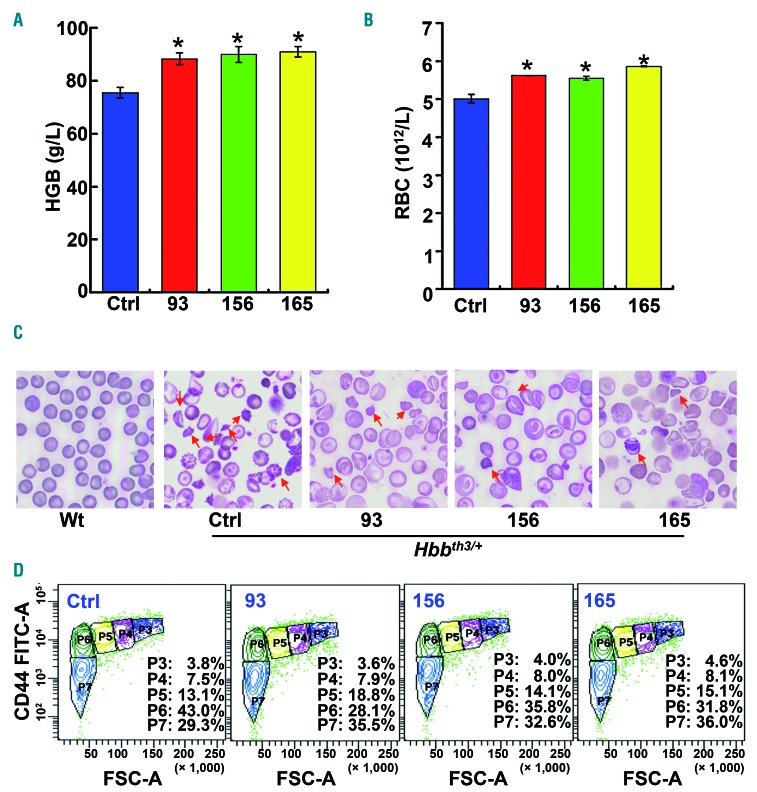
Genetic iron-overload disorders, mainly hereditary hemochromatosis and untransfused β-thalassemia, affect a large population worldwide. The primary etiology of iron overload in these diseases is insufficient production of hepcidin by the liver, leading to excessive intestinal iron absorption and iron efflux from macrophages. Hepcidin agonists would therefore be expected to ameliorate iron overload in hereditary hemochromatosis and β-thalassemia. In the current study, we screened our synthetic library of 210 thiazolidinone compounds and identified three thiazolidinone compounds, 93, 156 and 165, which stimulated hepatic hepcidin production. In a hemochromatosis mouse model with hemochromatosis deficiency, the three compounds prevented the development of iron overload and elicited iron redistribution from the liver to the spleen. Moreover, these compounds also greatly ameliorated iron overload and mitigated ineffective erythropoiesis in β-thalassemic mice. Compounds 93, 156 and 165 acted by promoting SMAD1/5/8 signaling through differentially repressing ERK1/2 phosphorylation and decreasing transmembrane protease serine 6 activity. Additionally, compounds 93, 156 and 165 targeted erythroid regulators to strengthen hepcidin expression. Therefore, our hepcidin agonists induced hepcidin expression synergistically through a direct action on hepatocytes via SMAD1/5/8 signaling and an indirect action via eythroid cells. By increasing hepcidin production, thiazolidinone compounds may provide a useful alternative for the treatment of iron-overload disorders.
Copyright© 2019 Ferrata Storti Foundation.
Figures
Comment in
-
New potential players in hepcidin regulation.Haematologica. 2019 Sep;104(9):1691-1693. doi: 10.3324/haematol.2019.224311. Haematologica. 2019. PMID: 31473605 Free PMC article. No abstract available.
Similar articles
-
SLN124, a GalNac-siRNA targeting transmembrane serine protease 6, in combination with deferiprone therapy reduces ineffective erythropoiesis and hepatic iron-overload in a mouse model of β-thalassaemia.Br J Haematol. 2021 Jul;194(1):200-210. doi: 10.1111/bjh.17428. Epub 2021 May 4. Br J Haematol. 2021. PMID: 33942901 Free PMC article.
-
A TMPRSS6-inhibiting mAb improves disease in a β-thalassemia mouse model and reduces iron in healthy humans.JCI Insight. 2025 Jun 23;10(12):e191813. doi: 10.1172/jci.insight.191813. eCollection 2025 Jun 23. JCI Insight. 2025. PMID: 40548380 Free PMC article. Clinical Trial.
-
Hepcidin as a therapeutic tool to limit iron overload and improve anemia in β-thalassemic mice.J Clin Invest. 2010 Dec;120(12):4466-77. doi: 10.1172/JCI41717. Epub 2010 Nov 22. J Clin Invest. 2010. PMID: 21099112 Free PMC article.
-
Modulation of hepcidin as therapy for primary and secondary iron overload disorders: preclinical models and approaches.Hematol Oncol Clin North Am. 2014 Apr;28(2):387-401. doi: 10.1016/j.hoc.2013.11.004. Epub 2014 Jan 18. Hematol Oncol Clin North Am. 2014. PMID: 24589273 Free PMC article. Review.
-
Hepcidin agonists as therapeutic tools.Blood. 2018 Apr 19;131(16):1790-1794. doi: 10.1182/blood-2017-11-737411. Epub 2018 Mar 9. Blood. 2018. PMID: 29523504 Free PMC article. Review.
Cited by
-
SLN124, a GalNac-siRNA targeting transmembrane serine protease 6, in combination with deferiprone therapy reduces ineffective erythropoiesis and hepatic iron-overload in a mouse model of β-thalassaemia.Br J Haematol. 2021 Jul;194(1):200-210. doi: 10.1111/bjh.17428. Epub 2021 May 4. Br J Haematol. 2021. PMID: 33942901 Free PMC article.
-
Disordered Maternal and Fetal Iron Metabolism Occurs in Preterm Births in Human.Dis Markers. 2022 Aug 22;2022:1664474. doi: 10.1155/2022/1664474. eCollection 2022. Dis Markers. 2022. PMID: 36046373 Free PMC article.
-
Iron metabolism and iron disorders revisited in the hepcidin era.Haematologica. 2020 Jan 31;105(2):260-272. doi: 10.3324/haematol.2019.232124. Print 2020. Haematologica. 2020. PMID: 31949017 Free PMC article. Review.
-
New Deferric Amine Compounds Efficiently Chelate Excess Iron to Treat Iron Overload Disorders and to Prevent Ferroptosis.Adv Sci (Weinh). 2022 Oct;9(29):e2202679. doi: 10.1002/advs.202202679. Epub 2022 Aug 28. Adv Sci (Weinh). 2022. PMID: 36031399 Free PMC article.
-
Lactate administration improves laboratory parameters in murine models of iron overload.Blood. 2024 Mar 14;143(11):1045-1049. doi: 10.1182/blood.2023021695. Blood. 2024. PMID: 38194678 Free PMC article.
References
Publication types
MeSH terms
Substances
LinkOut - more resources
Full Text Sources
Medical
Miscellaneous
