. 2019 May;180(1):78-86.
doi: 10.1104/pp.18.00906. Epub 2019 Feb 21.

Regeneration of Solanum tuberosum Plants from Protoplasts Induces Widespread Genome Instability

Affiliations

Regeneration of Solanum tuberosum Plants from Protoplasts Induces Widespread Genome Instability

Michelle Fossi et al. Plant Physiol. 2019 May.

Abstract

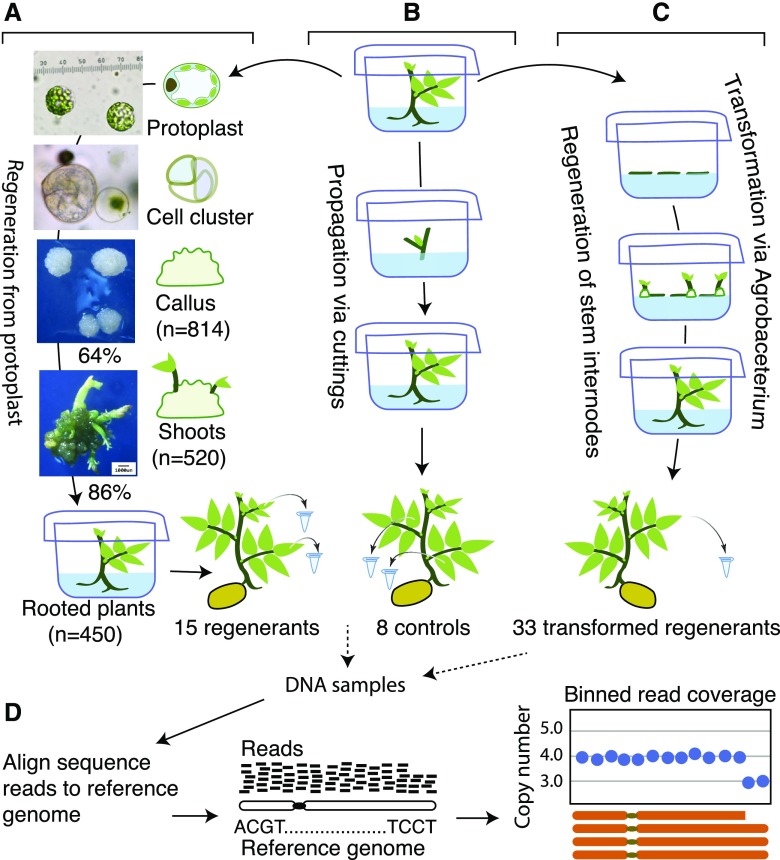
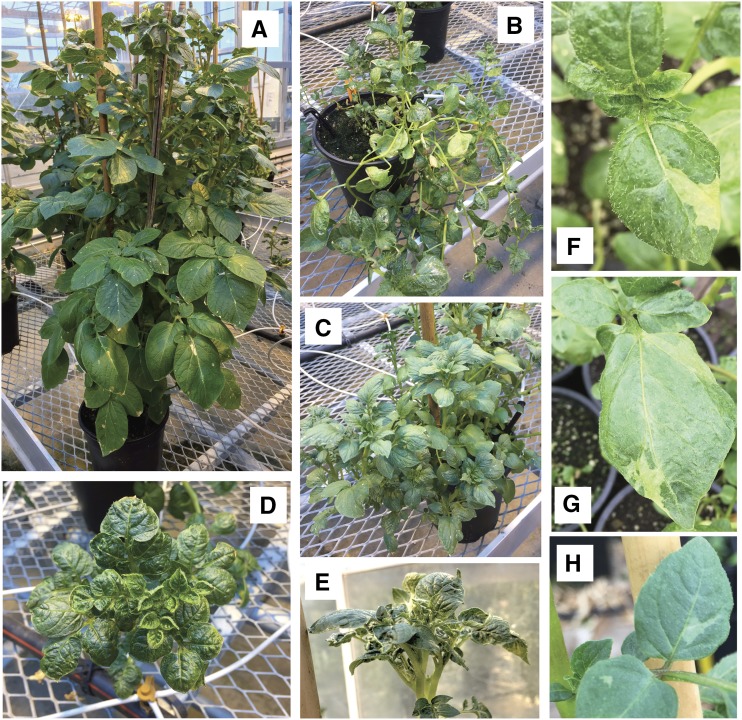
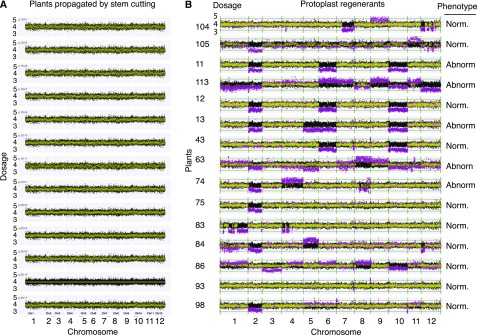
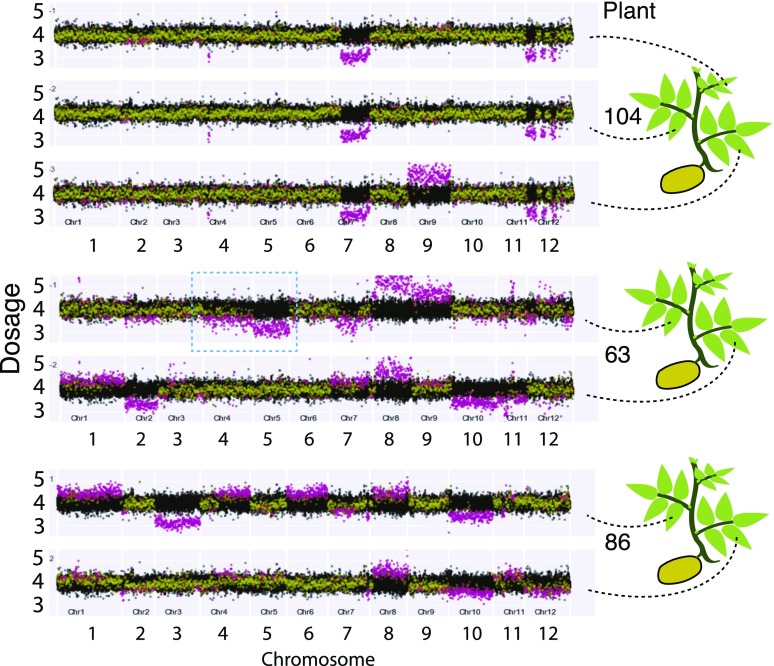
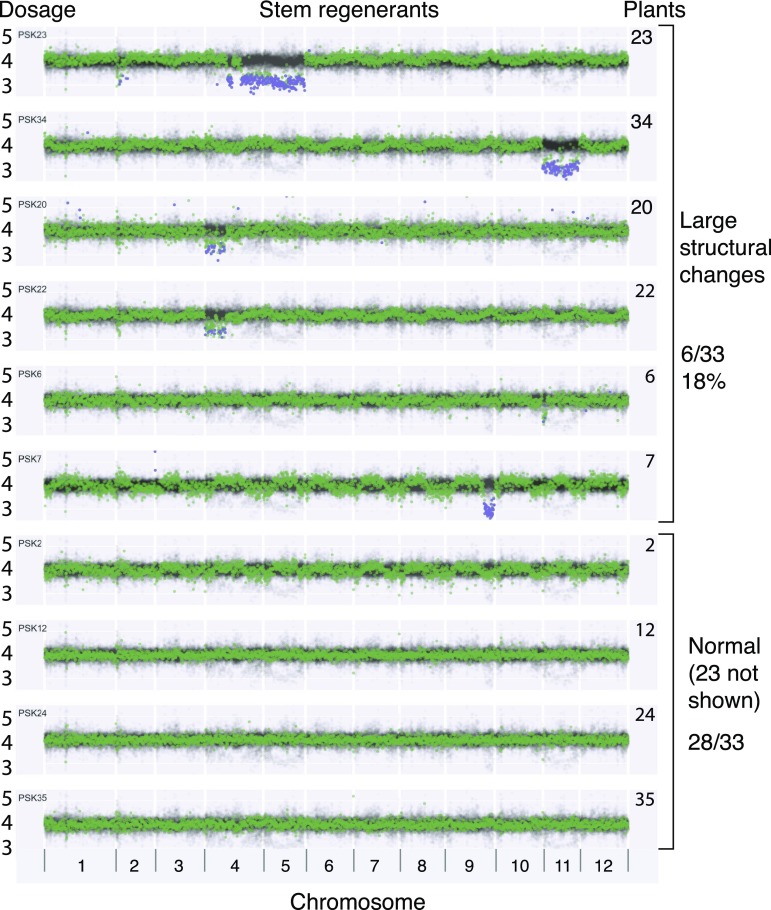
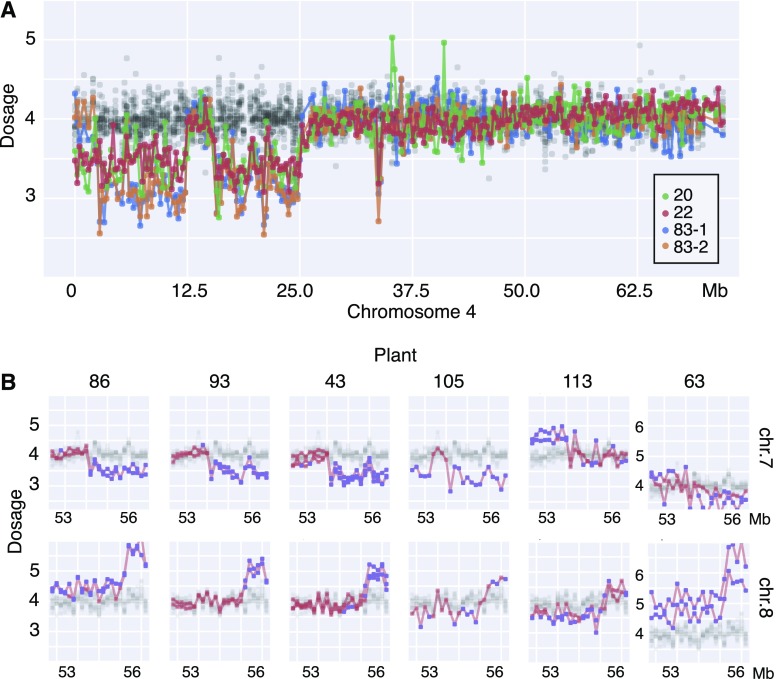
Nontransgenic genome editing in regenerable protoplasts, plant cells free of their cell wall, could revolutionize crop improvement because it reduces regulatory and technical complexity. However, plant tissue culture is known to engender frequent unwanted variation, termed somaclonal variation. To evaluate the contribution of large-scale genome instability to this phenomenon, we analyzed potatoes (Solanum tuberosum) regenerated from either protoplasts or stem explants for copy number changes by comparison of Illumina read depth. Whereas a control set of eight plants that had been propagated by cuttings displayed no changes, all 15 protoplast regenerants tested were affected by aneuploidy or structural chromosomal changes. Certain chromosomes displayed segmental deletions and duplications ranging from one to many. Resampling different leaves of the same plant found differences in three regenerants, indicating frequent persistence of instability. By comparison, 33 regenerants from stem explants used for Agrobacterium-mediated transformation displayed less frequent but still considerable (18%) large-scale copy number changes. Repetition of certain instability patterns suggested greater susceptibility in specific genomic sites. These results indicate that tissue culture, depending on the protocol used, can induce genomic instability resulting in large-scale changes likely to compromise final plant phenotype.


Figures

Figure 1.
Figure 1.
Plant production and analysis. A to D, Schematic representation of experimental workflow. Autotetraploid potato var Desiree was cultured axenically and either protoplasted and regenerated (A), propagated from nodal buds without callus formation or regeneration (B), or regenerated from stem explants after Agrobacterium transformation (C). Cumulative numbers or process efficiencies for two experiments are shown in A. Derivation of dosage plots (D) was used to detect copy number variation for chromosomes.
Figure 2.
Figure 2.
Phenotype of potato plants regenerated from protoplasts. A, Normal phenotype. B to E, Abnormal phenotypes. F to H, Leaf variegation displayed by tuber-propagated clones of original regenerant 86 (F, G) and 63 (H). Chimerism of phenotype matches genomic chimerism. See Figures 3 and 4 for genomic details illustrating persistent instability.
Figure 3.
Figure 3.
Frequent genome dosage changes in plants regenerated from protoplasts. Each horizontal track represents genomic dosage values of one individual. Dosage on y axis is plotted versus 250-kb chromosomal bins on the x axis, arrayed consecutively for the 12 chromosomes of potato. To provide the range variation expected from normal (Norm) genomes, the control dataset of 8 propagated plants is plotted in black for each plot track. Individual sample data points are yellow if not statistically different from controls and magenta if they display significant divergence according to the Z-score statistics with 5% false discovery rate. Four genomic copies are expected from autotetraploidy. Bins with high variability were dropped (see “Materials and Methods”). A, Dosage plots from controls consist of 8 plants propagated using stem cuttings. Five controls were sampled twice, and each preparation is plotted independently. The next to last control plant (p.2D-10) was used for standardization of all others read counts. B, Dosage plots for 15 individuals regenerated from protoplasts. Two to four independent samples are plotted together for each plant, except for plant 105 (See Supplemental Fig. S1 for separate plots of all biological replicates). Because calli could be resampled, it is possible that some plants may derive from the same protoplast. Abnorm, abnormal.
Figure 4.
Figure 4.
Persistent instability in protoplast regenerants. Each horizontal track represents genomic dosage values in one leaf. Samples from the same individuals are grouped as indicated on the right. Dosage on y axis is plotted versus 250-kb chromosomal bins on the x axis, arrayed consecutively for the 12 chromosomes of potato. To provide the range variation expected from normal genomes, the dataset of 8 controls (13 samples) is plotted in black for each plot track. Individual sample data points are yellow if not statistically different from controls and magenta if they display significant divergence (false discovery rate = 0.05). Four genomic copies are expected from autotetraploidy. Bins with high variability were dropped (see “Materials and Methods”). See Figure 2 for variegation phenotype of plant 63 and 86. Chr, chromosome.
Figure 5.
Figure 5.
Genome dosage changes in plants regenerated from stem internodes during Agrobacterium transformation. Dosage on y axis is plotted versus 250-kb chromosomal bins on the x axis, arrayed consecutively for the 12 chromosomes of potato. The green points on each horizontal track represent genomic dosage values of one individual. To represent variation, the same cumulative dataset of all 33 plants is plotted in low opacity black for each track. Only four of the plants with normal genome profiles are shown. The Z-score statistics was calculated using the whole dataset of 33 plants because controls specific to these conditions were not available. The false discovery rate alpha parameter was set at 20%, and the positive points were marked blue. Four genomic copies are expected from autotetraploidy.
Figure 6.
Figure 6.
Conserved chromosomal changes across independent individuals. Each horizontal track represents genomic dosage values plotted in 250-kb bins along chromosomes. Control measurements from propagated individuals are shown in black at low opacity. A, Similar deletion events in chromosome (chr.) 4 of plant 83 (protoplast regenerant, two biological replicates, blue and orange) and plant 20 and 22 (stem internode regenerants, green and brick red). See Figures 3 and 4 and “Materials and Methods” for details of dosage plots method. B, Dosage plots for terminal left regions of chr. 7 and chr. 8. Close up of the “deletion-7, duplication-8” paired pattern for three very clear examples (left) and three additional likely case (right). All except 105 have two biological replicates (independent samples from the same plant). The y axis is shifted for the rightward most plot set to display high dosage points. Orange data points are not significantly different from controls, while blue data points use false discovery rate = 0.05.

Similar articles

Cited by

References

    1. Andersson M, Turesson H, Olsson N, Fält A-S, Ohlsson P, Gonzalez MN, Samuelsson M, Hofvander P (2018) Genome editing in potato via CRISPR-Cas9 ribonucleoprotein delivery. Physiol Plant 164: 378–384 - PubMed
    1. Bairu MW, Aremu AO, Van Staden J (2011) Somaclonal variation in plants: Causes and detection methods. Plant Growth Regul 63: 147–173
    1. Bao PH, Granata S, Castiglione S, Wang G, Giordani C, Cuzzoni E, Damiani G, Bandi C, Datta SK, Datta K, et al. (1996) Evidence for genomic changes in transgenic rice (Oryza sativa L.) recovered from protoplasts. Transgenic Res 5: 97–103 - PubMed
    1. Beaujean A, Sangwan RS, Lecardonnel A, Sangwan-Norreel BS (1998) Agrobacterium-mediated transformation of three economically important potato cultivars using sliced internodal explants: An efficient protocol of transformation. J Exp Bot 49: 1589–1595
    1. Benjamini Y, Hochberg Y (1995) Controlling the false discovery rate: A practical and powerful approach to multiple testing. J R Stat Soc Series B Stat Methodol 57: 289–300

LinkOut - more resources