. 2019 Apr 24;39(17):3277-3291.
doi: 10.1523/JNEUROSCI.2473-18.2018. Epub 2019 Feb 21.

The Strength of Alpha-Beta Oscillatory Coupling Predicts Motor Timing Precision

Affiliations

The Strength of Alpha-Beta Oscillatory Coupling Predicts Motor Timing Precision

Laetitia Grabot et al. J Neurosci. .

Abstract

Precise timing makes the difference between harmony and cacophony, but how the brain achieves precision during timing is unknown. In this study, human participants (7 females, 5 males) generated a time interval while being recorded with magnetoencephalography. Building on the proposal that the coupling of neural oscillations provides a temporal code for information processing in the brain, we tested whether the strength of oscillatory coupling was sensitive to self-generated temporal precision. On a per individual basis, we show the presence of alpha-beta phase-amplitude coupling whose strength was associated with the temporal precision of self-generated time intervals, not with their absolute duration. Our results provide evidence that active oscillatory coupling engages α oscillations in maintaining the precision of an endogenous temporal motor goal encoded in β power; the when of self-timed actions. We propose that oscillatory coupling indexes the variance of neuronal computations, which translates into the precision of an individual's behavioral performance.SIGNIFICANCE STATEMENT Which neural mechanisms enable precise volitional timing in the brain is unknown, yet accurate and precise timing is essential in every realm of life. In this study, we build on the hypothesis that neural oscillations, and their coupling across time scales, are essential for the coding and for the transmission of information in the brain. We show the presence of alpha-beta phase-amplitude coupling (α-β PAC) whose strength was associated with the temporal precision of self-generated time intervals, not with their absolute duration. α-β PAC indexes the temporal precision with which information is represented in an individual's brain. Our results link large-scale neuronal variability on the one hand, and individuals' timing precision, on the other.

Keywords: alpha; beta; cross-frequency coupling; phase–amplitude coupling; time perception; timing.


Figures

Figure 1.
Figure 1.
Probing behavioral precision (CV) and accuracy (ER) using a time production paradigm. A, Time course of an experimental trial. Participants received feedback on their performance for all trials in Blocks 1 and 4, and for 15% of trials in Blocks 2, 3, 5, and 6. The inset plot depicts the evoked MEG responses locked to R1. B, Probability density function of all TP when producing 1.45 s (gray) and 1.56 s (black). The dots and bars indicate their respective means and SD. C, Schematic depiction of how temporal precision and accuracy were quantified. The black dotted line depicts an example of a produced time interval drawn from a Gaussian distribution of produced intervals (solid black curve; mean μ and SD σ). The next panels plot the precision and the accuracy across blocks and participants. D, Accuracy in time production computed as ER (= production/target) per block and per individual (dot). The accuracy of TP did not significantly change in the course of the experiment. E, Temporal precision computed as CV over time productions per block and per individual (dot). The temporal precision of TP did not significantly change in the course of the experiment.
Figure 2.
Figure 2.
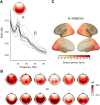
Oscillatory power in brain activity during time production. A, The PSD was computed during the produced interval (0.4–1.2 s) and averaged across sensors, conditions and participants. The average PSD (thick line) across individuals (gray lines) showed a clear peak 10 Hz. The topo map shows the PSD averaged between 8 and 12 Hz. B, The individual topographic maps for PSD. C, Grand-average cortical source estimations revealed an occipito-parietal distribution of the oscillatory power.
Figure 3.
Figure 3.
α–β PAC during time production. A, Individual comodulograms showing the presence of significant α–β PAC as measured by the MI. The individual topographic maps (insets, top right; nose on top) provide the spatial distribution of the α–β MI observed at the scalp level: 10 sensors showing the highest MI (inset, white dots) were selected for the comodulogram. The white outlines on the individual comodulograms delineate significant Z-scored values (values >4, i.e., p < 0.0001). B, Grand average comodulogram across all trials, all participants, and all sensors, showing significant α–β PAC. The average topographic map of the α–β MI (inset, top right) shares the same scale as in A. C, Z-score MIs were source-reconstructed in cortex. Brain regions showing maximal MI as computed on the basis of α (top) or β (bottom) power are reported.
Figure 4.
Figure 4.
Individual α peak frequency (iAPF) correlates with α frequency observed in α–β PAC. To ensure that the α rhythm captured in the PSD (Fig. 2A) was involved in PAC computation, we correlated an individual α peak frequency with the frequency corresponding to each individual's maximal α–β MI (r = 0.763, p = 0.004).
Figure 5.
Figure 5.
α–β PAC during time production computed with DAR model. We replicated the individual results of α–β PAC (Fig. 3A) using a novel DAR model (Dupré la Tour et al., 2017). The full comodulograms of Z-scored DAR values are plotted for each individual. Topographic maps of α–β DAR values are plotted in the right insets. The white contour corresponds to Z-score values >4 highlighting significant oscillatory coupling. In the DAR approach, and for consistency in comparing results, we kept the same set of sensors as in Figure 3A. For instance, in participant S02, the sensors showing maximal PAC with Tort's method (highlighted in white in the topographic inset) did not match with the sensors showing maximal PAC with DAR models; this spatial discrepancy explains why no significant α–β PAC is observed in the comodulogram of S02 despite significant coupling (yellow DAR values on the topographic insets). The DAR method provided a narrower focus on higher frequencies of power modulation, suggesting slightly larger specificity of high-power modulation. It is noteworthy that for both the Tort and the DAR methods, the peak of the high-frequency (Tort method = 27.2 Hz, SD = 3.9; DAR method = 34.5 Hz, SD = 2.3) were located in the vicinity of the β and lower γ frequencies. This suggests that for every α cycle at least one cycle of β was transiently modulated by the phase of α oscillation. As reported in Results, the peak frequencies for α and β found in the α–β PAC with the DAR method showed no harmonic relationship [t = 18.641, df = 11, p < 0.001, CI95 = (11.1; 14.0)].
Figure 6.
Figure 6.
α–β PAC is specific to the timed interval R1–R2. To ensure that α–β coupling was related to endogenous timing processes, we contrasted PAC during temporal production (R1–R2 period) with PAC during the motor preparation to R1 of the same trial (−0.8 s to R1). All participants (n = 12) were included in this analysis. The strength of α–β PAC was significantly higher during the time production interval compared with motor preparation during the self-initiation of the time interval. The white line delineates a significant cluster corresponding to p = 0.037.
Figure 7.
Figure 7.
The strength of α–β coupling does not index absolute time production. Trials were split according to the length of the temporal production (left graph: gray, individual data; blue, green and red, mean and SEM for short, intermediate and long trials, respectively). A significant and comparable MI was found suggesting comparable α-β coupling whatever the length of the produced interval.
Figure 8.
Figure 8.
The relation between α phase and β power does not predict the length of produced temporal intervals. A, The time series were locked on the peak of the α oscillations (bottom, dark line, SD marked by dashed lines) and beta power (15–40 Hz) were computed for each duration. For illustration, the time-frequency phase-locked to the α peak is shown for the MEG sensor showing maximal α–β MI for one representative participant (S06). B, The α phase at which β power was maximal was extracted for each participant (circular histogram) and each duration category (blue, short; green, intermediate; red: long). C, The α phase difference between long and short temporal productions at which β power was maximal was plotted for each participant. The length of the bar represents the number of participants with the same phase value. A Rayleigh test indicated that the phase difference between long and short categorizations was not uniform (p < 0.02, mean = 1.4°), confirming a significant phase concentration when beta power was maximal. However, the mean phase difference between long and short duration distribution did not significantly differ (t = 0.12, p = 0.91), providing no evidence for a different α–β phase relationship as a function of endogenous timing.
Figure 9.
Figure 9.
The strength of α–β PAC indexes the precision of temporal performance. A, Over all experimental blocks and participants, CVs of temporal production were significantly correlated with the strength of α–β PAC. Additionally, α or β power showed no independent contribution to CV (Fig. 10), suggesting that α–β PAC exclusively accounted for participants' temporal precision. The shaded area around the regression line indicated standard error. B, The relative changes in CV and α–β PAC were correlated when participants switched from one block to another, suggesting that the transitions in α–β coupling strength were associated with transitions in CV between blocks. The shaded area around the regression line indicated standard error. C, Cortical source estimations of the correlations between α–β PAC and precision (CV). α–β PAC was calculated on the signal projected into source space. The correlations with CV were performed using Spearman's correlation. The blue areas indicate the labels that showed significant correlations.
Figure 10.
Figure 10.
α And β power do not independently contribute to the precision in temporal performance. Over all blocks and participants, the CVs of time interval did not significantly correlate with the strength of α or β power or their ratio (AC, respectively). In the absence of significant contributions of α or β power to ER in TP (D, E, respectively), TP did not correlate with the strength of β power or α–β power ratio. This set of results further strengthens the finding that it is the coupling of α–β, and not α or β alone that contribute to temporal precision.
Figure 11.
Figure 11.
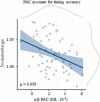
α–β PAC index performance accuracy. A decrease in ER of time production was near significantly correlated with a decrease in α–β coupling strength. The shaded area around the regression line indicated standard error.
Figure 12.
Figure 12.
The strength of α–β oscillatory coupling regulates timing precision. An individual's precision in a TP task may depend on the strength of α–β PAC. Higher precision corresponds to a narrower distribution of temporal productions (top left; behavioral data for individual S09), whereas a lower precision corresponds to a broader distribution of temporal productions (bottom left, behavioral data for individual S02). Right, Time-frequency plots of the mean β power time-locked to the phase of α (here, the peak). For one individual with high behavioral precision (S09; top), a strong α–β PAC can be seen. The peak count distribution of β power maxima relative to the α phase that are provided on the right shows, for individual S09, a strong concentration of maximal β power with the α phase. Conversely, for the individual with lower behavioral precision (S02; bottom), a weaker α–β PAC was found: the peak count distribution of β power maxima relative to the α phase for this individual showed a flatter distribution indicated a lower dependency of β power maxima on α phase.

References

    1. Akam T, Kullmann DM (2014) Oscillatory multiplexing of population codes for selective communication in the mammalian brain. Nat Rev Neurosci 15:111–122. 10.1038/nrn3668 - DOI - PMC - PubMed
    1. Alekseichuk I, Turi Z, Amador de Lara G, Antal A, Paulus W (2016) Spatial working memory in humans depends on theta and high gamma synchronization in the prefrontal cortex. Curr Biol 26:1513–1521. 10.1016/j.cub.2016.04.035 - DOI - PubMed
    1. Arnal LH, Doelling KB, Poeppel D (2014) Delta–beta coupled oscillations underlie temporal prediction accuracy. Cereb Cortex 25:3077–3085. - PMC - PubMed
    1. Aru J, Aru J, Priesemann V, Wibral M, Lana L, Pipa G, Singer W, Vicente R (2015) Untangling cross-frequency coupling in neuroscience. Curr Opin Neurobiol 31:51–61. 10.1016/j.conb.2014.08.002 - DOI - PubMed
    1. Axmacher N, Henseler MM, Jensen O, Weinreich I, Elger CE, Fell J (2010) Cross-frequency coupling supports multi-item working memory in the human hippocampus. Proc Natl Acad Sci U S A 107:3228–3233. 10.1073/pnas.0911531107 - DOI - PMC - PubMed

Publication types

LinkOut - more resources