. 2019 Mar 12;116(11):5102-5107.
doi: 10.1073/pnas.1812405116. Epub 2019 Feb 21.

Circadian clock protein Rev-erbα regulates neuroinflammation

Affiliations

Circadian clock protein Rev-erbα regulates neuroinflammation

Percy Griffin et al. Proc Natl Acad Sci U S A. .

Abstract

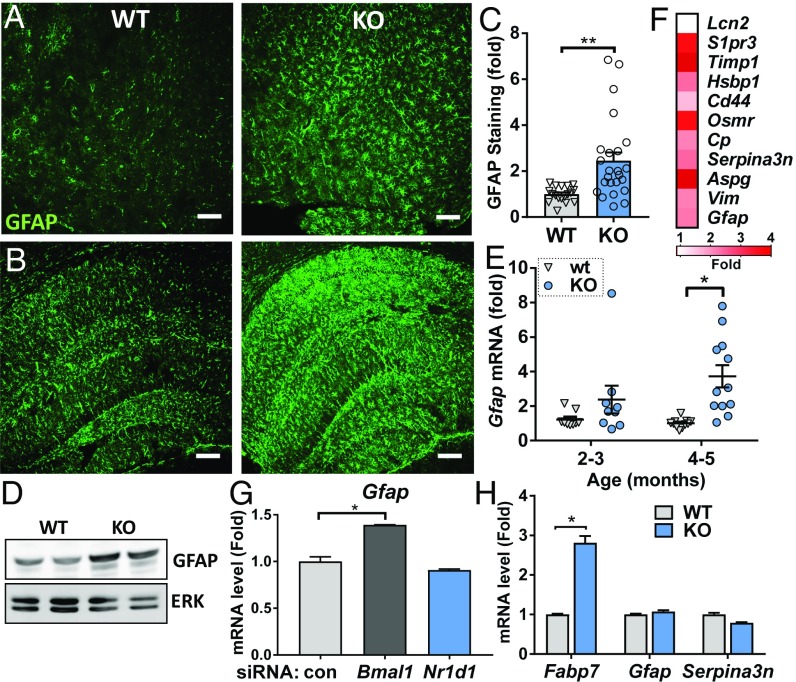
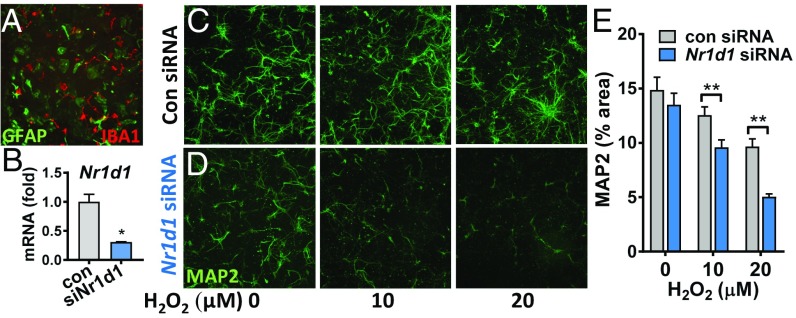
Circadian dysfunction is a common attribute of many neurodegenerative diseases, most of which are associated with neuroinflammation. Circadian rhythm dysfunction has been associated with inflammation in the periphery, but the role of the core clock in neuroinflammation remains poorly understood. Here we demonstrate that Rev-erbα, a nuclear receptor and circadian clock component, is a mediator of microglial activation and neuroinflammation. We observed time-of-day oscillation in microglial immunoreactivity in the hippocampus, which was disrupted in Rev-erbα-/- mice. Rev-erbα deletion caused spontaneous microglial activation in the hippocampus and increased expression of proinflammatory transcripts, as well as secondary astrogliosis. Transcriptomic analysis of hippocampus from Rev-erbα-/- mice revealed a predominant inflammatory phenotype and suggested dysregulated NF-κB signaling. Primary Rev-erbα-/- microglia exhibited proinflammatory phenotypes and increased basal NF-κB activation. Chromatin immunoprecipitation revealed that Rev-erbα physically interacts with the promoter regions of several NF-κB-related genes in primary microglia. Loss of Rev-erbα in primary astrocytes had no effect on basal activation but did potentiate the inflammatory response to lipopolysaccharide (LPS). In vivo, Rev-erbα-/- mice exhibited enhanced hippocampal neuroinflammatory responses to peripheral LPS injection, while pharmacologic activation of Rev-erbs with the small molecule agonist SR9009 suppressed LPS-induced hippocampal neuroinflammation. Rev-erbα deletion influenced neuronal health, as conditioned media from Rev-erbα-deficient primary glial cultures exacerbated oxidative damage in cultured neurons. Rev-erbα-/- mice also exhibited significantly altered cortical resting-state functional connectivity, similar to that observed in neurodegenerative models. Our results reveal Rev-erbα as a pharmacologically accessible link between the circadian clock and neuroinflammation.

Keywords: Rev-erbα; circadian; microglia; neuroinflammation.


Conflict of interest statement

The authors declare no conflict of interest.

Figures

Fig. 1.
Fig. 1.
Rev-erbα deletion induces hippocampal microglial activation. (A) Images (60×) of Iba1 staining in 6- to 8-mo WT (Left) and RKO (Right) mouse hippocampus, with Iba1 volume quantification (B). Mice were killed at CT4 (AM, Top) and CT16 (PM, Bottom). n = 4–5 mice per genotype, three images per mouse. (C) Iba1 staining in 5-mo RKO hippocampus (Right) and WT littermates (Left). (D) qPCR analysis for microglial inflammatory genes from the hippocampus of WT and RKO mice. n = 6 mice per group. (E) Representative 100× 3D surface rendering showing CD68+ puncta (yellow) within Iba1+ microglia (red), in RKO hippocampus compared with WT, with quantification. n = 4 mice per genotype with three 40× fields of view each. (F) Representative skeletonized microglial reconstructions and (G) quantification of branches per cell. n = 3 mice, n = 35 microglia. ns, not significant; *P < 0.05, **P < 0.01, or ***P < 0.001 by two-tailed t test with Welch’s correction. (Scale bars, 50 µm for A, 120 µm for C.)
Fig. 2.
Fig. 2.
Rev-erbα–mediated neuroinflammation is associated with dysregulated microglial NF-κB signaling. (A) Relative expression of transcripts related to different aspects of neuroinflammation taken from microarray analysis performed on 5-mo RKO and WT mice (n = 3 per genotype). Colored bars on Left indicate hand-curated functional groupings. (B) Gene Ontology (GO) term analysis of microarray data for biological processes up-regulated in RKO hippocampus compared with WT (P > 0.05, fold change >2). (C) Representative images showing p65 nuclear translocation in RKO microglia compared with WT at baseline, 1 h and 3 h, following LPS stimulation. Quantification of the percent microglia with nuclear p65 staining (DAPI/p65 overlap) is shown (Right). n = 3 separate experiments. (D) qPCR showing mRNA expression for the proinflammatory mediators Il6 and Tnfa in primary WT and RKO microglia. (E) ChIP analysis of WT microglia for the Rev-erbα target Bmal1, NF-κB signaling components Traf2 as well as Nfkbib, a negative control S100a4 and a normalization control Gapdh. *P < 0.05 or **P < 0.01 by two-tailed t test with Welch’s correction. ****P < 0.001 by two-way ANOVA with Tukey’s multiple comparisons test.
Fig. 3.
Fig. 3.
Rev-erbs modulate LPS-induced neuroinflammation in vivo. (A) qPCR analysis of the hippocampal tissue from 5-mo RKO mice or WT littermates treated with i.p. LPS for 6 h. (B) ELISA for IL-1β levels in media from WT or RKO primary microglia treated with LPS alone or in combination with SR9009 as well as ATP for inflammasome maturation. (C) qPCR of WT or RKO primary microglia treated with LPS alone or in combination with SR9009 for Il6 mRNA expression. Gene expression is normalized to LPS-treated WT cells. (D) mRNA expression of Il6 in WT astrocytes treated with LPS and/or SR9009. (E) qPCR analysis of hippocampus from WT mice pretreated with SR9009 or vehicle (Veh) and then stimulated with i.p. LPS for 6 h. In both A and E, data are shown as fold increase from vehicle-treated WT mice (no LPS). *P < 0.05 by two-tailed t test.
Fig. 4.
Fig. 4.
Astrocyte activation in Rev-erbα−/− brain is cell nonautonomous. (A and B) GFAP staining in the piriform cortex (A) and hippocampus (B) of 5-mo RKO mice (KO, Right) compared with WT (Left). (C) Quantification of the percent area GFAP immunoreactivity in the cortex of RKO (KO) and WT littermates at 2–5 mo. n = 10–11 mice per genotype. (D) Western blot analysis for relative GFAP protein levels in WT and RKO mouse hippocampi as well as the associated ERK loading control. (E) qPCR analysis of Gfap mRNA expression in hippocampus from 2- to 3-mo and 4- to 5-mo RKO (KO) and WT mice. n = 10–12 mice per group. (F) Average expression fold changes for pan-reactive astrocyte activation markers in the hippocampus of 5-mo Rev-erbα−/−, compared with WT littermates, n = 3 mice per genotype. (G) qPCR for Gfap mRNA expression in primary WT astrocytes treated with control siRNA as well as siRNA targeting Bmal1 and Nr1d1. (H) Relative mRNA expression levels for the Rev-erbα target Fabp7, and astrocyte activation markers Gfap as well as Serpina3n in primary WT and RKO astrocytes. *P < 0.05 or **P < 0.01 by two-tailed t test with Holm–Sidak correction for multiple comparisons.
Fig. 5.
Fig. 5.
Loss of Rev-erbα in glia impacts neuronal health in vitro. (A) GFAP/Iba1 costain of mixed glial culture used to generate the CM. (B) Nr1d1 mRNA levels in mixed glia following treatment with control or Nr1d1 siRNA. (C and D) Representative 10× images of MAP2 staining of neurons grown in CM from mixed glia treated with control (C) or Nr1d1 siRNA (D). After 7 d in CM, neurons were treated with H2O2 for 24 h. (E) Quantification of MAP2 staining in C and D. n = 51–60 wells per group from at least three separate experiments. *P < 0.05 by two-tailed t test and **P < 0.05 by two-tailed t test with Holm–Sidak correction for multiple comparisons.
Fig. 6.
Fig. 6.
Impaired cortical resting-state functional connectivity in Rev-erbα KO mice. (A) Functional parcellation of resting-stage networks using the average correlation structure across all mice studied. (B) Resting-state FC maps in WT and KO mice (n = 5–6 mice per genotype). Top row: Group-averaged retrosplenial FC. High correlation is indicated by reds; anticorrelation by blues. KO mice exhibit reduced interhemispheric FC as well as reduced anterior–posterior anticorrelations. Bottom row: Group-averaged somatosensory FC. WT mice exhibited lower interhemispheric FC compared with KO mice while both groups exhibited qualitatively similar ipsilateral FC. (C) Regional differences in correlation structure for each region-of-interest (ROI) pair. Maps of FC for each ROI examined in A were compressed into a difference matrix for quantitative evaluation of pairwise regional FC between WT and KO. WT mice exhibit significantly increased retrosplenial FC and significantly decreased FC in somatosensory regions compared with KO mice (black boxes). Cortical regions: C, cingulate; M, motor; R, retrosplenial; S, somatosensory. (D) Spatial PCA performed on the whole cortex correlation difference matrix assesses the topography of all pairwise correlation differences across groups. The first two PCs from this process explain 39% (PC1) and 16% (PC2) of the variance, respectively. This unbiased approach also reveals differences in KO mice involving retrosplenial (PC1) and somatosensory regions (PC2). Dotted black outlines of the ROIs are for reference.

Similar articles

Cited by

References

    1. Mohawk JA, Green CB, Takahashi JS. Central and peripheral circadian clocks in mammals. Annu Rev Neurosci. 2012;35:445–462. - PMC - PubMed
    1. Bass J, Takahashi JS. Circadian integration of metabolism and energetics. Science. 2010;330:1349–1354. - PMC - PubMed
    1. Kondratov RV, Antoch MP. The clock proteins, aging, and tumorigenesis. Cold Spring Harb Symp Quant Biol. 2007;72:477–482. - PubMed
    1. Musiek ES, Holtzman DM. Mechanisms linking circadian clocks, sleep, and neurodegeneration. Science. 2016;354:1004–1008. - PMC - PubMed
    1. Heneka MT, et al. Neuroinflammation in Alzheimer’s disease. Lancet Neurol. 2015;14:388–405. - PMC - PubMed

Publication types

MeSH terms

Substances