

Asymmetric independence modeling identifies novel gene-environment interactions
- PMID: 30792419
- PMCID: PMC6385186
- DOI: 10.1038/s41598-019-38983-z
Asymmetric independence modeling identifies novel gene-environment interactions
Abstract
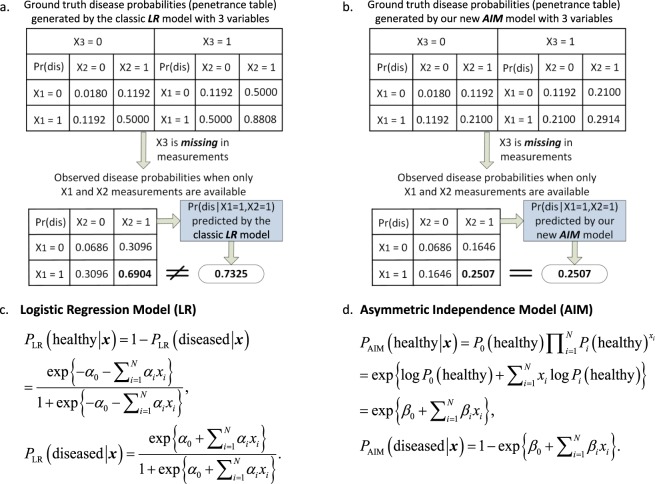
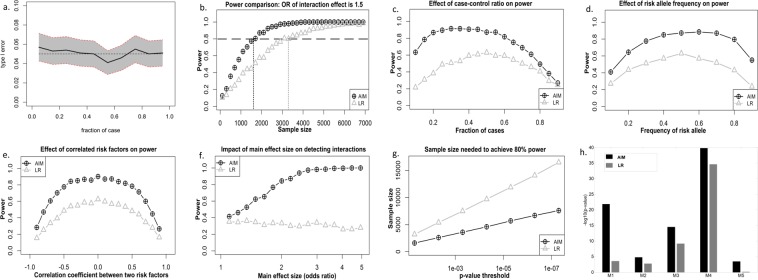
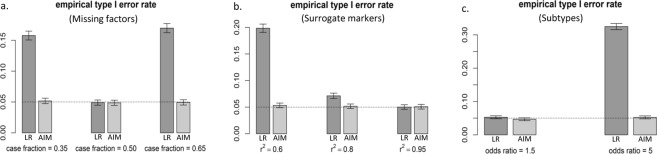
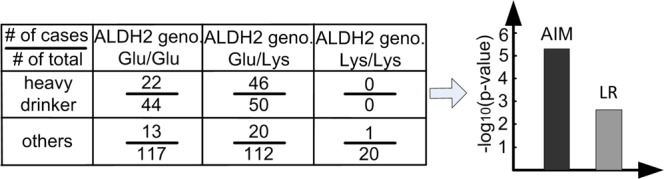
Most genetic or environmental factors work together in determining complex disease risk. Detecting gene-environment interactions may allow us to elucidate novel and targetable molecular mechanisms on how environmental exposures modify genetic effects. Unfortunately, standard logistic regression (LR) assumes a convenient mathematical structure for the null hypothesis that however results in both poor detection power and type 1 error, and is also susceptible to missing factor, imperfect surrogate, and disease heterogeneity confounding effects. Here we describe a new baseline framework, the asymmetric independence model (AIM) in case-control studies, and provide mathematical proofs and simulation studies verifying its validity across a wide range of conditions. We show that AIM mathematically preserves the asymmetric nature of maintaining health versus acquiring a disease, unlike LR, and thus is more powerful and robust to detect synergistic interactions. We present examples from four clinically discrete domains where AIM identified interactions that were previously either inconsistent or recognized with less statistical certainty.
Conflict of interest statement
The authors declare no competing interests.
Figures
Similar articles
-
The case-only test for gene-environment interaction is not uniformly powerful: an empirical example.Genet Epidemiol. 2013 May;37(4):402-7. doi: 10.1002/gepi.21713. Epub 2013 Mar 13. Genet Epidemiol. 2013. PMID: 23595356 Free PMC article.
-
Functional logistic regression approach to detecting gene by longitudinal environmental exposure interaction in a case-control study.Genet Epidemiol. 2014 Nov;38(7):638-51. doi: 10.1002/gepi.21852. Epub 2014 Sep 12. Genet Epidemiol. 2014. PMID: 25219575 Free PMC article.
-
Subset-Based Analysis Using Gene-Environment Interactions for Discovery of Genetic Associations across Multiple Studies or Phenotypes.Hum Hered. 2018;83(6):283-314. doi: 10.1159/000496867. Epub 2019 May 27. Hum Hered. 2018. PMID: 31132756 Free PMC article.
-
Natural and orthogonal interaction framework for modeling gene-environment interactions with application to lung cancer.Hum Hered. 2012;73(4):185-94. doi: 10.1159/000339906. Epub 2012 Aug 9. Hum Hered. 2012. PMID: 22889990 Free PMC article.
-
Further development of the case-only design for assessing gene-environment interaction: evaluation of and adjustment for bias.Int J Epidemiol. 2004 Oct;33(5):1014-24. doi: 10.1093/ije/dyh306. Epub 2004 Sep 9. Int J Epidemiol. 2004. PMID: 15358745 Review.
References
Publication types
MeSH terms
Grants and funding
LinkOut - more resources
Full Text Sources
Medical
