

Mutations in sigma 70 transcription factor improves expression of functional eukaryotic membrane proteins in Escherichia coli
- PMID: 30792443
- PMCID: PMC6384906
- DOI: 10.1038/s41598-019-39492-9
Mutations in sigma 70 transcription factor improves expression of functional eukaryotic membrane proteins in Escherichia coli
Abstract
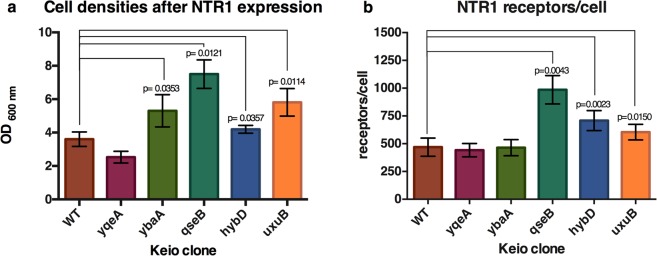
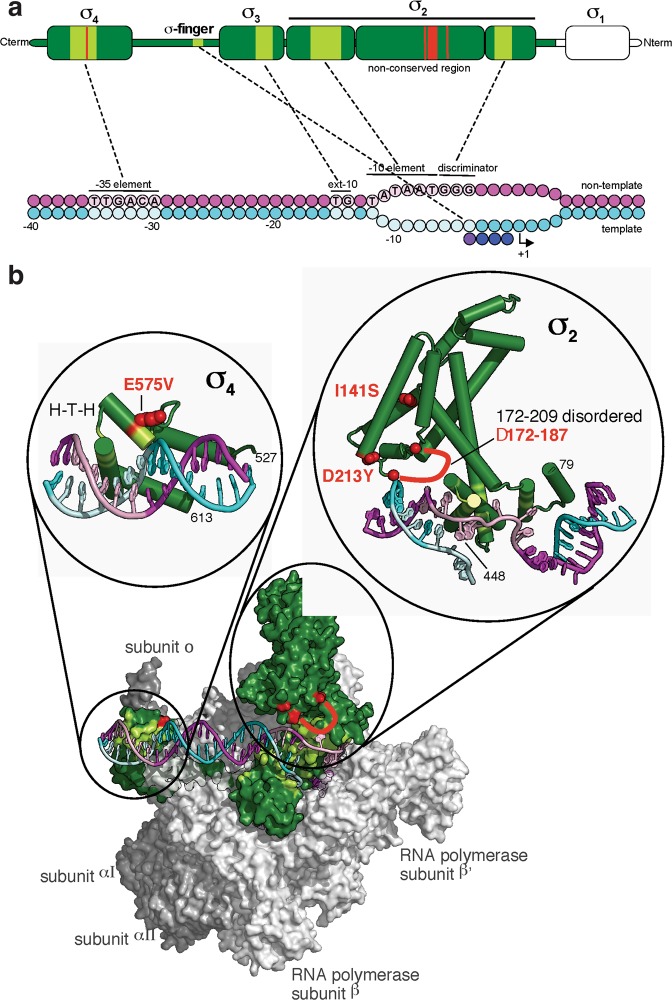
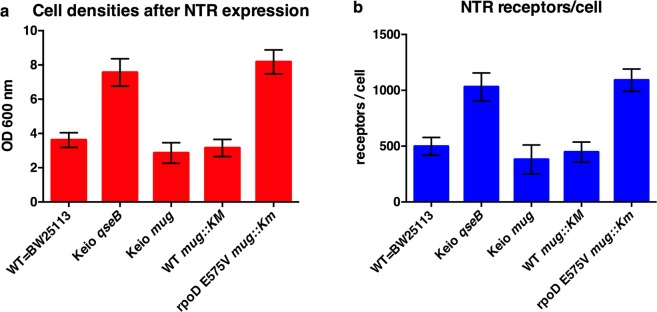
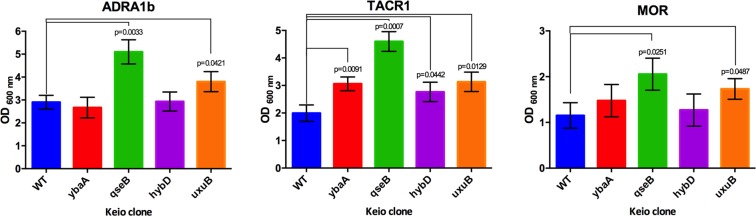
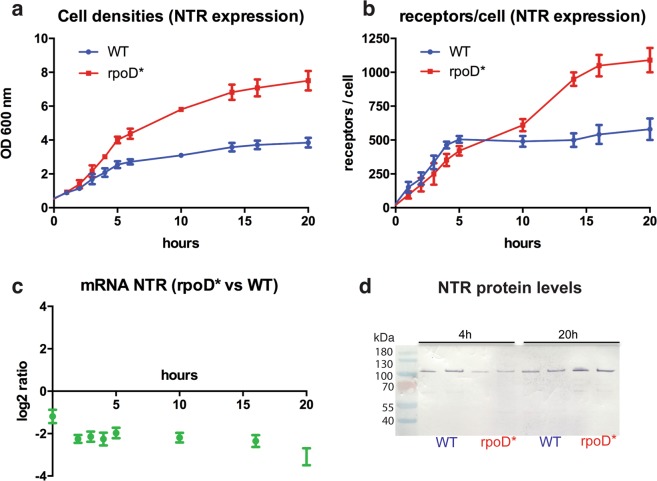
Eukaryotic integral membrane proteins (IMPs) are difficult to study due to low functional expression levels. To investigate factors for efficient biogenesis of eukaryotic IMPs in the prokaryotic model organism Escherichia coli, important, e.g., for isotope-labeling for NMR, we selected for E. coli cells expressing high levels of functional G protein-coupled receptors (GPCRs) by FACS. Utilizing an E. coli strain library with all non-essential genes systematically deleted, we unexpectedly discovered upon whole-genome sequencing that the improved phenotype was not conferred by the deleted genes but by various subtle alterations in the "housekeeping" sigma 70 factor (RpoD). When analyzing effects of the rpoD mutations at the transcriptome level we found that toxic effects incurred on wild-type E. coli during receptor expression were diminished by two independent and synergistic effects: a slower but longer-lasting GPCR biosynthesis and an optimized transcriptional pattern, augmenting growth and expression at low temperature, setting the basis for further bacterial strain engineering.
Conflict of interest statement
The authors declare no competing interests.
Figures
Similar articles
-
Tailoring of global transcription sigma D factor by random mutagenesis to improve Escherichia coli tolerance towards low-pHs.J Biotechnol. 2016 Apr 20;224:55-63. doi: 10.1016/j.jbiotec.2016.03.012. Epub 2016 Mar 10. J Biotechnol. 2016. PMID: 26971973
-
Changes in conserved region 3 of Escherichia coli sigma 70 mediate ppGpp-dependent functions in vivo.J Mol Biol. 1995 Oct 6;252(5):536-49. doi: 10.1006/jmbi.1995.0518. J Mol Biol. 1995. PMID: 7563072
-
Negative regulation of σ(70)-driven promoters by σ(70).Res Microbiol. 2011 Jun;162(5):461-9. doi: 10.1016/j.resmic.2011.03.005. Epub 2011 Mar 21. Res Microbiol. 2011. PMID: 21396442
-
Proteolysis of sigmaS (RpoS) and the general stress response in Escherichia coli.Res Microbiol. 2009 Nov;160(9):667-76. doi: 10.1016/j.resmic.2009.08.014. Epub 2009 Sep 16. Res Microbiol. 2009. PMID: 19765651 Review.
-
Transcriptional switching in Escherichia coli during stress and starvation by modulation of sigma activity.FEMS Microbiol Rev. 2010 Sep;34(5):646-57. doi: 10.1111/j.1574-6976.2010.00223.x. Epub 2010 Apr 14. FEMS Microbiol Rev. 2010. PMID: 20491934 Review.
Cited by
-
Synthetically-primed adaptation of Pseudomonas putida to a non-native substrate D-xylose.Nat Commun. 2024 Mar 26;15(1):2666. doi: 10.1038/s41467-024-46812-9. Nat Commun. 2024. PMID: 38531855 Free PMC article.
-
Protein over-expression in Escherichia coli triggers adaptation analogous to antimicrobial resistance.Microb Cell Fact. 2021 Jan 11;20(1):13. doi: 10.1186/s12934-020-01462-6. Microb Cell Fact. 2021. PMID: 33430875 Free PMC article.
-
Protein NMR: Boundless opportunities.J Magn Reson. 2019 Sep;306:187-191. doi: 10.1016/j.jmr.2019.07.037. Epub 2019 Jul 9. J Magn Reson. 2019. PMID: 31311710 Free PMC article. Review.
-
Extensively Drug-Resistant Klebsiella pneumoniae Counteracts Fitness and Virulence Costs That Accompanied Ceftazidime-Avibactam Resistance Acquisition.Microbiol Spectr. 2022 Jun 29;10(3):e0014822. doi: 10.1128/spectrum.00148-22. Epub 2022 Apr 18. Microbiol Spectr. 2022. PMID: 35435751 Free PMC article.
-
Sigma Factors as Potential Targets to Enhance Recombinant Protein Expression.Biotechnol Bioeng. 2025 Jun;122(6):1598-1607. doi: 10.1002/bit.28958. Epub 2025 Feb 24. Biotechnol Bioeng. 2025. PMID: 39994955 Free PMC article.
References
Publication types
MeSH terms
Substances
LinkOut - more resources
Full Text Sources
Molecular Biology Databases
