. 2019 Feb 12:11:1758835918821021.
doi: 10.1177/1758835918821021. eCollection 2019.

D-methionine alleviates cisplatin-induced mucositis by restoring the gut microbiota structure and improving intestinal inflammation

Affiliations

D-methionine alleviates cisplatin-induced mucositis by restoring the gut microbiota structure and improving intestinal inflammation

Cheng-Hsi Wu et al. Ther Adv Med Oncol. .

Abstract

Background: There are close links between chemotherapy-induced intestinal mucositis and microbiota dysbiosis. Previous studies indicated that D-methionine was an excellent candidate for a chemopreventive agent. Here, we investigated the effects of D-methionine on cisplatin-induced mucositis.

Materials and methods: Male Wistar rats (176-200 g, 6 weeks old) were given cisplatin (5 mg/kg) and treated with D-methionine (300 mg/kg). Histopathological, digestive enzymes activity, oxidative/antioxidant status, proinflammatory/anti-inflammatory cytokines in intestinal tissues were measured. Next-generation sequencing technologies were also performed to investigate the gut microbial ecology.

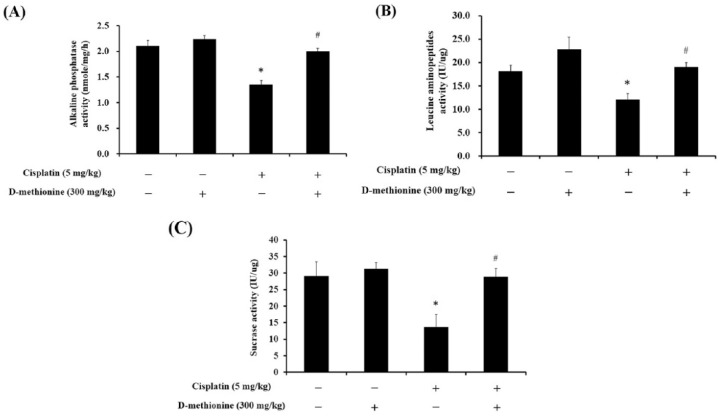
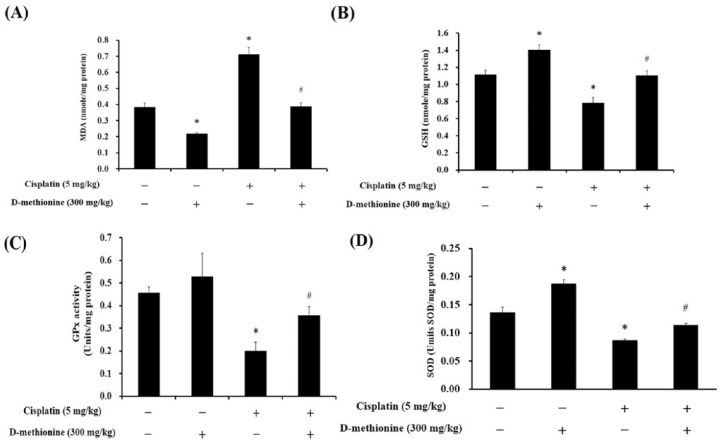
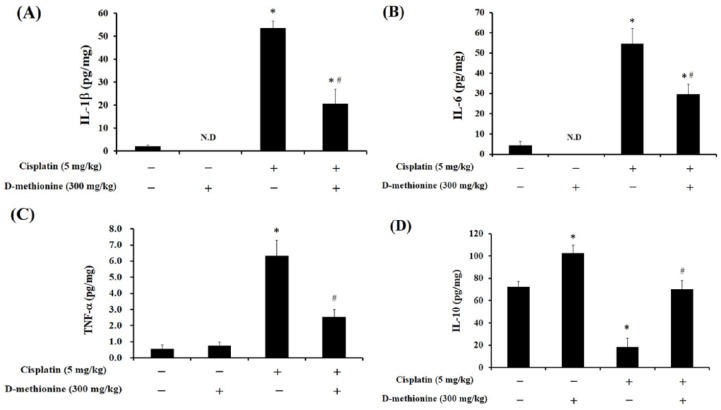
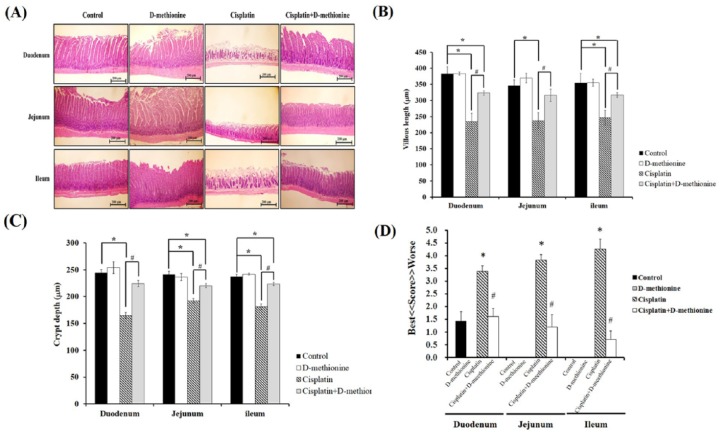
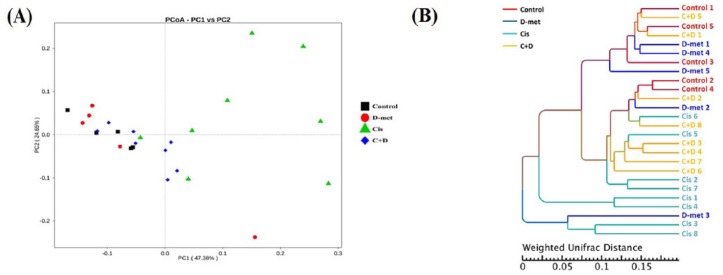
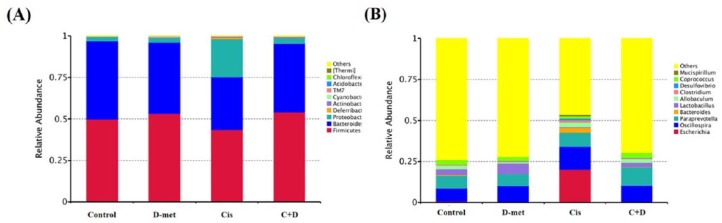
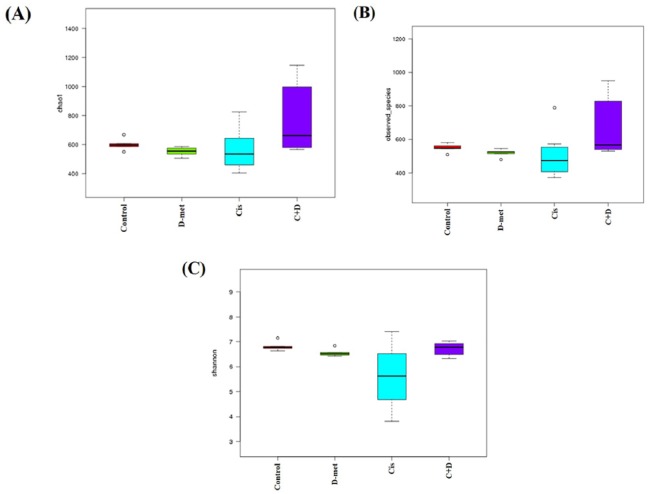
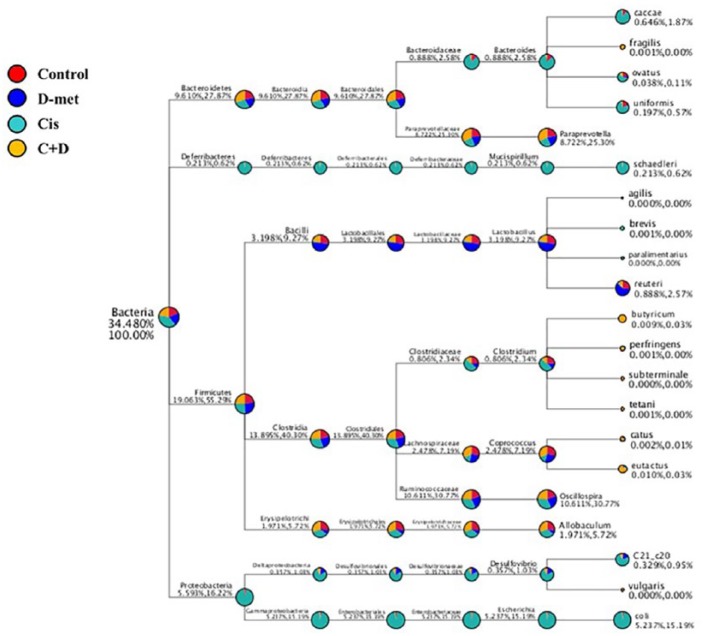
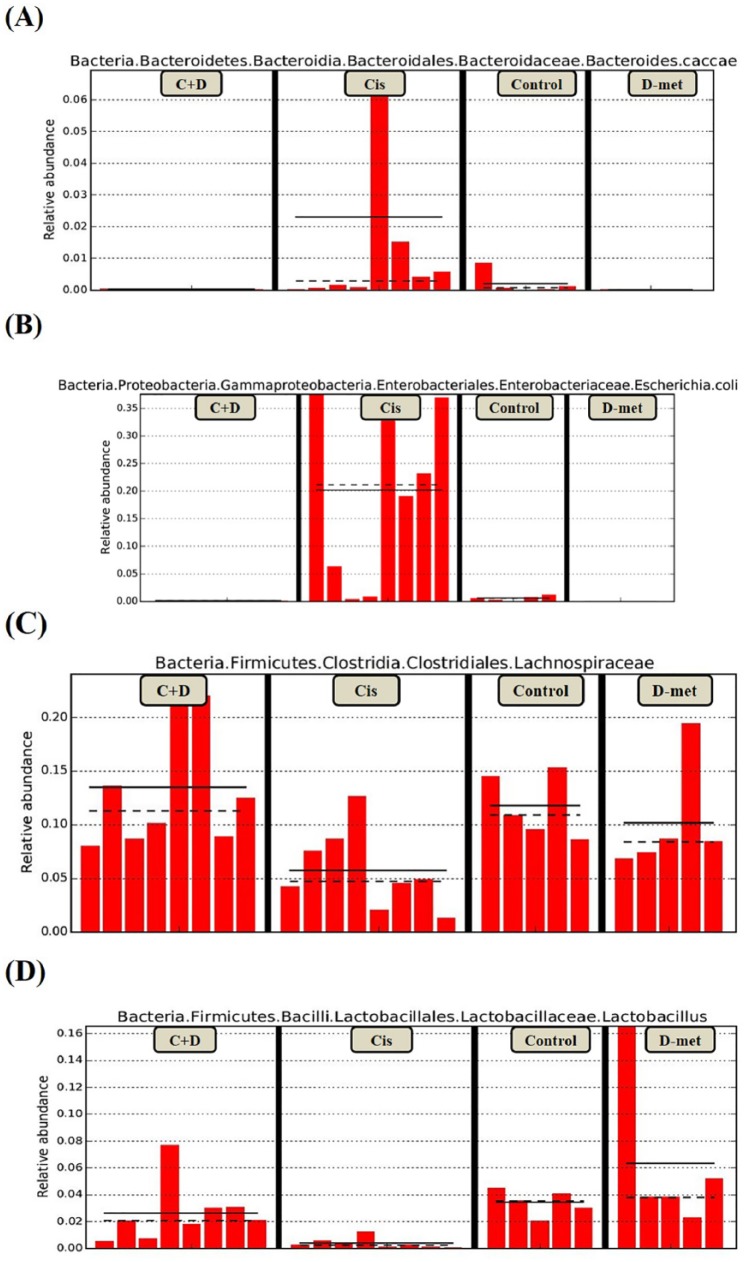
Results: D-methionine administration increased villus length and crypt depth and improved digestive enzyme (leucine aminopeptidase, sucrose and alkaline phosphatase) activities in the brush-border membrane of cisplatin-treated rats (p < 0.05). Furthermore, D-methionine significantly attenuated oxidative stress and inflammatory reaction and increased interleukin-10 levels in cisplatin-induced intestinal mucositis (p < 0.05). Cisplatin administration resulted in high relative abundances of Deferribacteres and Proteobacteria and a low diversity of the microbiota when compared with control groups, D-methionine only and cisplatin plus D-methionine. Cisplatin markedly increased comparative abundances of Bacteroides caccae, Escherichia coli, Mucispirillum schaedleri, Bacteroides uniformis and Desulfovibrio C21-c20, while Lactobacillus was almost completely depleted, compared with the control group. There were higher abundances of Lactobacillus, Lachnospiraceae, and Clostridium butyrium in cisplatin plus D-methionine rats than in cisplatin rats. D-methionine treatment alone significantly increased the number of Lactobacillus reuteri.

Conclusion: D-methionine protects against cisplatin-induced intestinal damage through antioxidative and anti-inflammatory effects. By enhancing growth of beneficial bacteria (Lachnospiraceae and Lactobacillus), D-methionine attenuates gut microbiome imbalance caused by cisplatin and maintains gut homeostasis.

Keywords: D-methionine; Lactobacillus; cisplatin; gastrointestinal mucositis; next-generation sequencing.


Conflict of interest statement

Conflict of interest statement: The authors declare that there is no conflict of interest.

Figures

Figure 1.
Figure 1.
Effects of D-methionine treatment on BBM enzymes: AP, LAP and sucrase in cisplatin-treated rats. Data are presented as mean ± SEM, n = 5–8. *represents a significant difference when compared with the control group; #represents a significant difference when compared with the cisplatin group (p < 0.05). AP, alkaline phosphatase; BBM, brush-border membrane; LAP, leucine aminopeptidase; SEM, standard error of the mean.
Figure 2.
Figure 2.
Effects of cisplatin and D-methionine administration on MDA and GSH concentrations and GPx and SOD activities in intestinal tissue homogenates. Data are presented as mean ± SEM, n = 5–8. *represents a significant difference when compared with the control group; #represents a significant difference when compared with the cisplatin group (p < 0.05). GPx, glutathione peroxidase; GSH, glutathione; MDA, malondialdehyde; SEM, standard error of the mean.
Figure 3.
Figure 3.
Effects of D-methionine on inflammation parameters in small intestinal homogenates after treatment with cisplatin. (a) IL-1β, (b) IL-6, (c) TNF-α and (d) IL-10. Data are presented as mean ± SEM, n = 5–8. *represents a significant difference when compared with the control group; #represents a significant difference when compared with the cisplatin group (p < 0.05). IL, interleukin; SEM, standard error of the mean; TNF, tumor necrosis factor.
Figure 4.
Figure 4.
Effects of D-methionine on small intestinal damage after cisplatin treatment. (a) Histological staining of representative intestine, (b) villus length, (c) crypt depth and (d) grading score of intestinal tissue damage. Data are presented as mean ± SEM, n = 5–8. *represents a significant difference when compared with the control group; #represents a significant difference when compared with the cisplatin group (p < 0.05). SEM, standard error of the mean.
Figure 5.
Figure 5.
Beta diversity comparisons of gut microbiomes. PCoA analysis (a) and UPGMA (b). UPGMA clustering tree based on weighted UniFrac distance. Weighted UniFrac considers both composition and abundance of microbiomes. On PCoA, each point represents a sample, plotted by a principal component on the x-axis and another principal component on the y-axis, with each group represented by a different color. The percentage on each axis indicates the contribution value to discrepancy among samples. Different colored symbols represent rats receiving different treatments and every symbol represents individual animals. The black squares indicate control group. The red circles indicate D-methionine group. The green triangles indicate treatment with cisplatin only. The blue diamonds indicate combined treatment of cisplatin and D-methionine. PCoA, principal coordinates analysis; UPGMA, unweighted pair group method with arithmetic mean.
Figure 6.
Figure 6.
Phylum and genus distributions of experimental groups. The relative abundances of gut microbiota phyla (a) and genera (b) were analyzed by next-generation sequencing of bacterial 16S DNA. The y-axis and x-axis represent relative abundance and group, respectively. On the right, ‘others’ represents total relative abundances of the phyla and genera not included in the top 10. At the phylum level, abundance changes in Bacteroidetes, Proteobacteria and Firmicutes were observed.
Figure 7.
Figure 7.
Alpha diversity indexes. Chao-1 (a), Observed species (b) and Shannon (c). The microbiota composition samples from four groups were clustered based on PCA, Pearson clustering and Shannon diversity index. Circles represent outliers. Group size is 5–8 individuals; results are shown as means ± SEM. PCA, principal component analysis; SEM, standard error of the mean.
Figure 8.
Figure 8.
Classification tree. The first circle represents the kingdom level (bacteria). The second circle (in same column) represents the phylum level. The subsequent order is class, order, family, genus and species. The first number (after the taxonomic ranks) represents the relative abundance of the whole corresponding taxon, while the second number represents the relative abundance of the corresponding taxon. For example, for Firmicutes (19.05%, 55.29%), 19.05% represents the proportion of this phylum among all phylum levels; 55.29% represents the proportion of this phylum among the four phylum levels.
Figure 9.
Figure 9.
Biomarkers are represented by bar chart. The relative abundance with statistical differences biomarker (genus and species level) were compared among groups. Bacteroides caccae (a), Escherichia coli (b), Lactobacillus (c), Lachnospiraceae (d). The present study shows the proportion of Bacteroides caccae, Escherichia coli in cisplatin-treated rats were elevated than that other three groups, reflect chronic exposure to cisplatin results in a more proinflammatory microbiota growth.

Similar articles

Cited by

References

    1. Montassier E, Gastinne T, Vangay P, et al. Chemotherapy-driven dysbiosis in the intestinal microbiome. Aliment Pharmacol Ther 2015; 42: 515–528. - PubMed
    1. Wang C, Yang S, Gao L, et al. Carboxymethyl pachyman (CMP) reduces intestinal mucositis and regulates the intestinal microflora in 5-fluorouracil-treated CT26 tumour-bearing mice. Food Funct 2018; 9: 2695–2704. - PubMed
    1. Touchefeu Y, Montassier E, Nieman K, et al. Systematic review: the role of the gut microbiota in chemotherapy- or radiation-induced gastrointestinal mucositis - current evidence and potential clinical applications. Aliment Pharmacol Ther 2014; 40: 409–421. - PubMed
    1. Guabiraba R, Besnard AG, Menezes GB, et al. IL-33 targeting attenuates intestinal mucositis and enhances effective tumor chemotherapy in mice. Mucosal Immunol 2014; 7: 1079–1093. - PMC - PubMed
    1. Chen MC, Chen YL, Lee CF, et al. Supplementation of magnolol attenuates skeletal muscle atrophy in bladder cancer-bearing mice undergoing chemotherapy via suppression of FoxO3 activation and induction of IGF-1. PLoS One 2015; 10: e0143594. - PMC - PubMed

LinkOut - more resources