. 2019 Feb 14:2:60.
doi: 10.1038/s42003-019-0292-y. eCollection 2019.

CaMello-XR enables visualization and optogenetic control of Gq/11 signals and receptor trafficking in GPCR-specific domains

Affiliations

CaMello-XR enables visualization and optogenetic control of Gq/11 signals and receptor trafficking in GPCR-specific domains

Dennis Eickelbeck et al. Commun Biol. .

Abstract

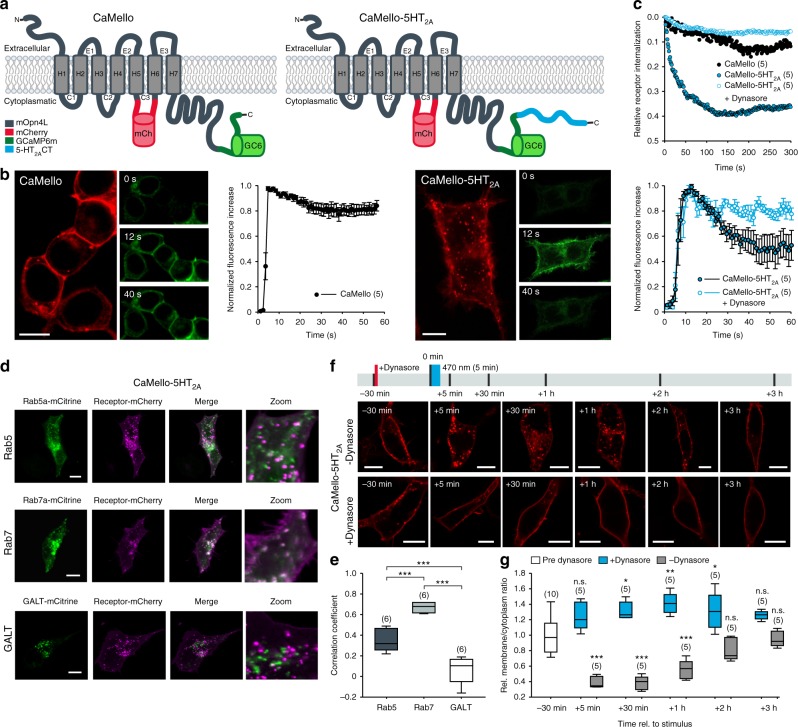
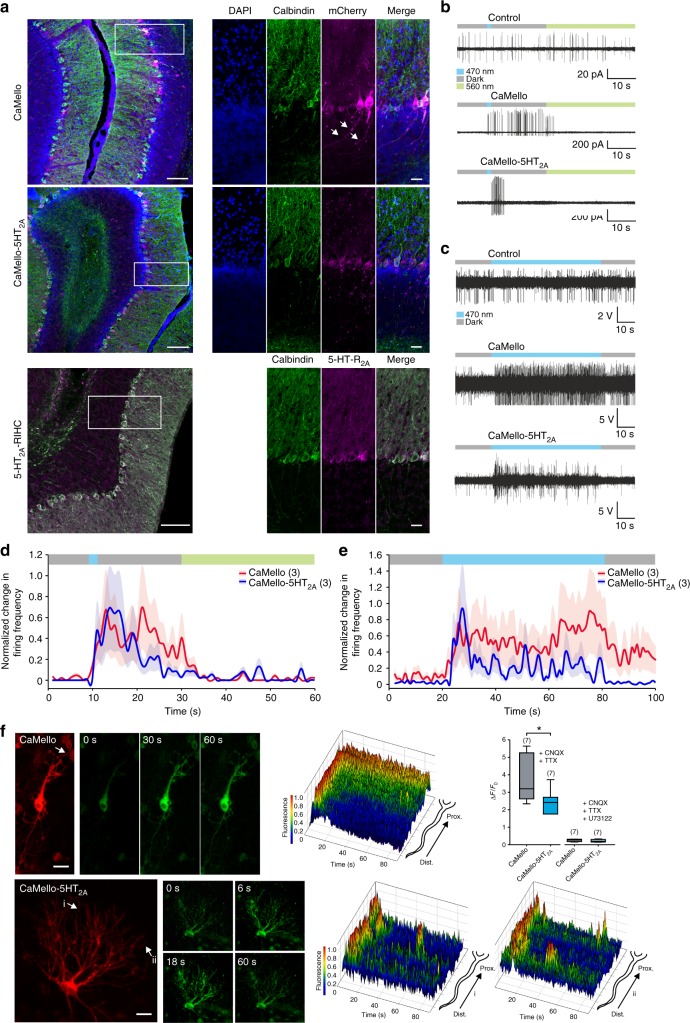
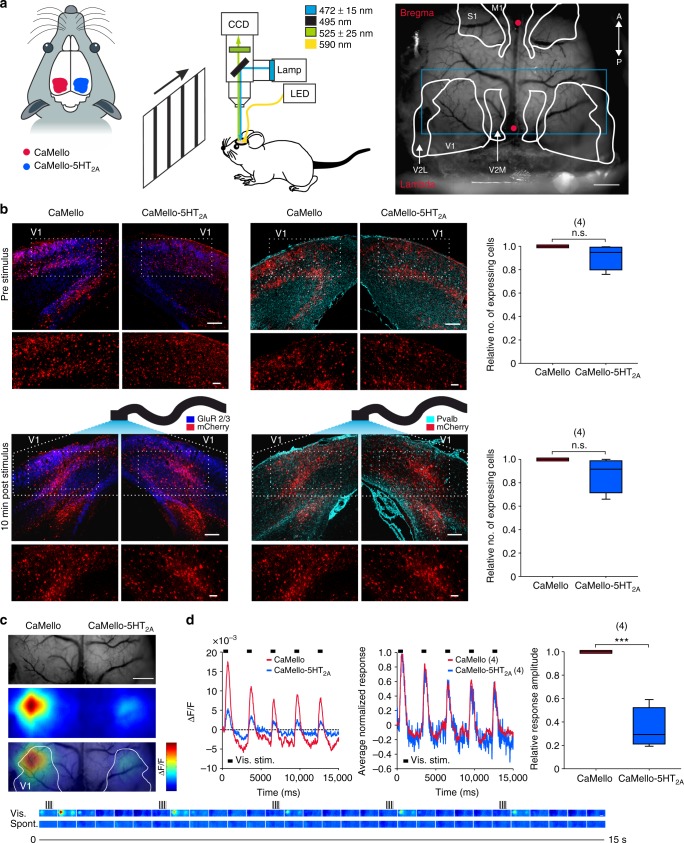
The signal specificity of G protein-coupled receptors (GPCRs) including serotonin receptors (5-HT-R) depends on the trafficking and localization of the GPCR within its subcellular signaling domain. Visualizing traffic-dependent GPCR signals in neurons is difficult, but important to understand the contribution of GPCRs to synaptic plasticity. We engineered CaMello (Ca2+-melanopsin-local-sensor) and CaMello-5HT2A for visualization of traffic-dependent Ca2+ signals in 5-HT2A-R domains. These constructs consist of the light-activated Gq/11 coupled melanopsin, mCherry and GCaMP6m for visualization of Ca2+ signals and receptor trafficking, and the 5-HT2A C-terminus for targeting into 5-HT2A-R domains. We show that the specific localization of the GPCR to its receptor domain drastically alters the dynamics and localization of the intracellular Ca2+ signals in different neuronal populations in vitro and in vivo. The CaMello method may be extended to every GPCR coupling to the Gq/11 pathway to help unravel new receptor-specific functions in respect to synaptic plasticity and GPCR localization.


Conflict of interest statement

The authors declare no competing interests.

Figures

Fig. 1
Fig. 1
Optogenetic control and visualization of Ca2+ signals with CaMello-XRs. a CaMello and CaMello-5HT2A design. Both chimeric constructs consist of mouse melanopsin (mOpn4L), mCherry inserted into C3 and GCaMP6m added to the CT. CaMello-5HT2A additionally has the 5-HT2A receptor CT appended (C: intracellular loop; CT: C-terminus; H: transmembrane helix; E: extracellular loop). b Time course of light-induced Ca2+ responses in HEK tsA201 cells. Transfected cells were visualized (mCherry, 561 nm) and Ca2+ signals were measured (GCaMP6m, 476 + 495 nm) (images). Normalized Ca2+ responses during 60 s of illumination (graphs), for CaMello-5HT2A with/without addition of dynamin inhibitor Dynasore (50 µM) (mean ± s.e.m.; n = 5 dishes). Scale bar, 10 µm. c Normalized activation-dependent receptor internalization monitored via differences in membrane-localized mCherry fluorescence reduction between stimulated (476 nm + 561 nm) and unstimulated (561 nm) trials, for CaMello-5HT2A with/without addition of Dynasore (50 µM) (mean; n = 5 dishes). d Colocalization of CaMello-5HT2A with Rab5a (-mCitrine, early endosome), Rab7a (early to late endosome) or GALT (beta-1,4-galactosyltransferase 1, trans-Golgi network) 5 min post stimulation with 476 nm light (5 min). Scale bar, 10 µm. e Averages of the calculated Pearson’s correlation coefficient for the colocalization as shown in d (box plot; one-way analysis of variance (ANOVA) and Holm-Sidak multiple comparison method; n = 6 individual cells for each colocalization pairing; ***p < 0.001). f Time course (confocal z-sections) of activation-dependent receptor internalization/recycling for CaMello-5HT2A. Cells were stimulated with blue light (476 nm, 5 min) at 0 min and receptor internalization/recycling was monitored over time. At −30 min Dynasore (50 µM) was added to the culture medium (control group). Scale bar, 10 µm. g Relative membrane to cytoplasm ratio as seen in (f) was calculated at indicated time points via quantitative mCherry fluorescence intensity analysis (box plot; one-way repeated measures analysis of variance (RM ANOVA) versus control and Holm-Sidak multiple comparison method; n = (x), # of individual cells per group; n.s. = not significant,*p < 0.05, **p < 0.01, ***p < 0.001; p left to right: 0.064, < 0.001, 0.037, < 0.001, 0.003, < 0.001, 0.036, 0.081, 0.101, 0.393)
Fig. 2
Fig. 2
Electrophysiological characterization of CaMello and CaMello-5HT2A. a Whole-cell patch clamp recordings of light-induced GIRK currents in HEK GIRK 1/2 cells activated and subsequently deactivated via CaMello or CaMello-5HT2A using a 10 s light pulse with a 50 s dark phase (top) or a 60 s light pulse (bottom) of 470 nm for activation followed by a 50 s light pulse of 560 nm for deactivation. b Repetitive activation/deactivation of GIRK currents via CaMello or CaMello-5HT2A followed by a 30 min dark phase and an additional activation/deactivation. c Time constants of GIRK current activation/deactivation by CaMello/CaMello-5HT2A using 10/50 s light pulses of 470/560 nm (left). Remaining GIRK current after 60 s of recording following 10 or 60 s of 470 nm light stimulation for CaMello/CaMello-5HT2A (middle). Maximal induced GIRK current amplitude for CaMello/CaMello-5HT2A using a 10 s light pulse of 470 nm (right) (box plot; one-way analysis of variance (ANOVA) and Holm-Sidak multiple comparison method or Mann–Whitney rank sum test; n = 5 individual cells recorded; n.s. = not significant, *p < 0.05, ***p < 0.001; p left to right: 0.889, < 0.001, 0.032). d Relative GIRK current response during repetitive light stimulation as shown in (b). e Light-pulse duration dependence of relative GIRK current activation by CaMello/CaMello-5HT2A using a 470 nm light pulse of the indicated duration for activation followed by a 560 nm light pulse for deactivation. f Wavelength dependence of relative GIRK current activation via CaMello/CaMello-5HT2A using a 1 s light pulse of the indicated wavelength for activation followed by a 560 nm light pulse for deactivation. The superimposed (CaMello-)GCaMP6m excitation spectrum was measured via 1 s 470 nm activation of CaMello followed by fluorescence emission recording (530–550 nm) for each indicated excitation wavelength (390–520 nm). g Intensity dependence of relative GIRK current activation via CaMello/CaMello-5HT2A using a 1 s 470 nm light pulse of the indicated intensity for activation followed by a 560 nm light pulse for deactivation after each activation. Plotted data (dg) presented as mean (± s.e.m); n = number of individual cells recorded
Fig. 3
Fig. 3
Optogenetic control and visualization of local Ca2+ signals in rat visual cortex organotypic cultures (OTCs). ac Time course of light-induced (a, b) and agonist-induced (c) local Ca2+ responses in rat visual cortex OTCs. Transfected cells were visualized using the mCherry reporter (CaMello + CaMello-5HT2A) or GCaMP6m (5-HT2A-R) and Ca2+ signals were light-induced (CaMello + CaMello-5HT2A, 476 + 495 nm) or agonist-induced (5-HT2A receptor, TCB-2 20 µM) and measured via GCaMP6m monitoring (images). 3D mesh plots of individual neurites (i, ii, iii) showing normalized local light-induced (CaMello + CaMello-5HT2A) or agonist-induced (5-HT2A-R) Ca2+ responses during 90 s of illumination from distal to proximal (plots). Repetitive activation and deactivation (561 nm) of CaMello induced Ca2+ responses (inset). Scale bar, 50 µm. d Comparison of maximal change in induced fluorescence intensity (∆F/F0). Maximal change in ∆F/F0 in the presence of CNQX (1 µM) and TTX (1 µM) (box plots; one-way analysis of variance (ANOVA) and Holm-Sidak multiple comparison method; n = 10 individual cells, pooled from five animals per group; **p < 0.01; p left to right: 0.001, 0.001) (top). Maximal change in ∆F/F0 in the presence of CNQX (1 µM), TTX (1 µM) and PLC antagonist U73122 (10 µM) (box plots; n = 10 individual cells, pooled from five animals per group) (bottom). e Differential expression pattern of CaMello, CaMello-5HT2A, and the 5-HT2A-R mCherry constructs in rat cortical neurons (OTCs). Receptor expression pattern was visualized using the mCherry reporter (561 nm) (images). Normalized fluorescence of the longest dendrite (length = box plot) was plotted against the length of each dendrite (plot) (box plots; n = 10 individual cells, pooled from five animals per group). Scale bar, 50 µm. f Colocalization of CaMello-5HT2A and the 5-HT2A-R mCherry construct with Rab7a in OTCs of the rat visual cortex as seen in Fig. 1 and Supplementary Figure 1 for HEK cells. Scale bar, 2 µm
Fig. 4
Fig. 4
Visualization of local Ca2+ signals in HEK cells and rat visual cortex organotypic cultures (OTCs) induced by endogenous GPCRs using mloCal-5HT2A. a mloCal-5HT2A design. The construct consists of an N-terminal GCaMP6m linked to mCherry, the 5-HT2A receptor C-terminus (CT) and a C-terminal CAAX membrane anchor (human KRAS isoform B C-terminal domain) (schematic). Time course of ATP-induced (10 µM) membrane-localized Ca2+ responses in HEK tsA201 cells transfected with mLocal-5HT2A (graph). Cells were visualized using the mCherry reporter (561 nm) and ATP-induced Ca2+ signals were measured via GCaMP6m monitoring (476 + 495 nm) (images). Scale bar, 10 µm. b Time course of neuronal network driven and 5-HT2A-R agonist modulated (TCB-2 20 µM) local Ca2+ responses in rat visual cortex OTCs without network blockers. Transfected cells were visualized using the mCherry reporter (561 nm) and Ca2+ signals were measured via GCaMP6m monitoring (476 + 495 nm) (top images). 3D mesh plot of an individual neurite (arrow) showing normalized local Ca2+ responses during 280 s of illumination with additional 5-HT2A agonist stimulation after 180 s from distal to proximal (top plots). Time course of 5-HT2A agonist modulated (TCB-2 20 µM) local Ca2+ responses in rat visual cortex OTCs in the presence of CNQX (1 µM) and TTX (1 µM). Transfected cells were visualized using the mCherry reporter (561 nm) and Ca2+ signals were measured via GCaMP6m monitoring (476 + 495 nm) (bottom images). 3D mesh plots of individual neurites (i, ii) showing normalized local Ca2+ responses during 280 s of illumination with additional 5-HT2A-R agonist stimulation after 90 s from distal to proximal (bottom plots). Scale bar, 20 µm
Fig. 5
Fig. 5
Optogenetic sustained and transient modulation of neuronal firing in the cerebellum in vivo and in vitro combined with visualization of local Ca2+ signals. a Sagittal images depicting brain sections of the cerebellar cortex expressing CaMello or CaMello-5HT2A compared to the native 5-HT2A receptor (IHC: immunohistochemistry). Scale bar, 100 µm overview, 25 µm zoom. b Example traces of light-induced modulation of Purkinje cell (PC) firing in cerebellar slices by CaMello, CaMello-5HT2A or mCherry control. The protocol to control the receptor consisted of an initial 10 s dark phase (gray) followed by a 1 s, 470 nm light pulse (blue) to activate the receptor, followed by an additional dark phase of 19 s and a 30 s, 560 nm light pulse (green) for deactivation of the receptor. c Example traces of in vivo optrode PC recordings from anaesthetized mice expressing CaMello, CaMello-5HT2A or mCherry control. The protocol to control the receptor consisted of an initial 10 s dark phase (gray) followed by a 60 s, 470 nm light pulse (blue) and an additional dark phase of 10 s. d, e Light-induced change in firing frequency for cerebellar slice recordings (d) or in vivo optrode recordings (e). Change in firing frequency during the indicated protocol (see color bar and b, c) was normalized for each individual cell for CaMello and CaMello-5HT2A and pooled (mean ± s.e.m.; n = 3 animals per group). f Time course of light-induced local Ca2+ responses in rat cerebellum OTCs. Transfected cells were visualized using the mCherry reporter and Ca2+ signals were light-induced (476 + 495 nm) and measured via GCaMP6m monitoring (images). 3D mesh plots of individual neurites (arrow: CaMello; i, ii: CaMello-5HT2A) showing normalized local light-induced Ca2+ responses during 90 s of illumination from distal to proximal (plots). Comparison of maximal change in induced fluorescence intensity (∆F/F0). Maximal change in ∆F/F0 in the presence of CNQX (1 µM) and TTX (1 µM) or additional PLC antagonist U73122 (10 µM) (box plot; unpaired t-test; n = 7 individual cells, pooled from four animals per group; *p < 0.05; p = 0.031) (box plot). Scale bar, 25 µm
Fig. 6
Fig. 6
Simultaneous photostimulation and Ca2+-imaging of visually evoked responses in the primary visual cortex in vivo. a Scheme of the experimental setup. Visual stimuli were presented on a monitor at 20 cm in front of the mouse. Between recording (and photostimulation) sessions, yellow light (590 nm) was used to deactivate the constructs. Mice were anesthetized and head-fixed. Vascular pattern of the cortex overlaid with schematics showing different cortical regions (V1: primary visual; V2L: lateral secondary visual; V2M: medial secondary visual; S1: primary sensory; M1: primary motor; red dots: bregma/lambda; blue rectangle: imaged area, depicted in (c)). Scale bar, 1 mm. b Coronal images depicting brain sections of the visual cortex expressing CaMello and CaMello-5HT2A for animals before and 10 min after stimulation. Pyramidal neurons were antibody-stained against GluR2/3, while Pvalb+ neurons were stained against parvalbumin (GluR: glutamate receptor; Pvalb: parvalbumin) (images). The relative number of expressing cells in the illuminated area was compared for animals before/after stimulation (box plot; unpaired t-test; n = 4 animals per group; n.s. = not significant; p from top to bottom: 0.079, 0.067) (box plot). Scale bar, 150 µm overview, 50 µm zoom. c Depiction of the imaged area. Vascular pattern of the imaged cortical region (top). Activation across V1 and neighboring visual areas after visual stimulation with changes in activity over time shown as relative change in fluorescence (∆F/F) (middle). Overlay of the two images above (bottom). Image frames show GCaMP6m signals in response to visual stimulation (upper row, vis.) with moving gratings (see icons on top) and spontaneous activity (lower row, spont.). Changes in activity over time are expressed as relative change in fluorescence (∆F/F). Each frame represents the average fluorescence change across 500 ms of recording. Scale bar, 1 mm. d Traces depicting the time course of spatial averages across V1 for CaMello and CaMello-5HT2A in response to visual stimulation, average of 30 trials (left). Comparison of the averaged (n = 4 animals) normalized responses of both constructs (middle). Comparison of maximal visual response amplitudes (box plot; unpaired t-test; n = 4 animals; ***p < 0.001; p = 0.000137) (right)

Similar articles

Cited by

References

    1. Berridge MJ, Bootman MD, Roderick HL. Calcium signalling: dynamics, homeostasis and remodelling. Nat. Rev. Mol. Cell Biol. 2003;4:517–529. doi: 10.1038/nrm1155. - DOI - PubMed
    1. Cullen PJ. Decoding complex Ca2+ signals through the modulation of Ras signaling. Curr. Opin. Cell Biol. 2006;18:157–161. doi: 10.1016/j.ceb.2006.02.012. - DOI - PubMed
    1. Berridge MJ. Calcium microdomains: organization and function. Cell Calcium. 2006;40:405–412. doi: 10.1016/j.ceca.2006.09.002. - DOI - PubMed
    1. Desouza N, et al. Protein kinase A and two phosphatases are components of the inositol 1,4,5-trisphosphate receptor macromolecular signaling complex. J. Biol. Chem. 2002;277:39397–39400. doi: 10.1074/jbc.M207059200. - DOI - PubMed
    1. Berridge MJ. Inositol trisphosphate and calcium signalling mechanisms. Biochim. Et. Biophys. Acta - Mol. Cell Res. 2009;1793:933–940. doi: 10.1016/j.bbamcr.2008.10.005. - DOI - PubMed

Publication types

MeSH terms