

Evolution of brain network dynamics in neurodevelopment
- PMID: 30793068
- PMCID: PMC6330215
- DOI: 10.1162/NETN_a_00001
Evolution of brain network dynamics in neurodevelopment
Abstract
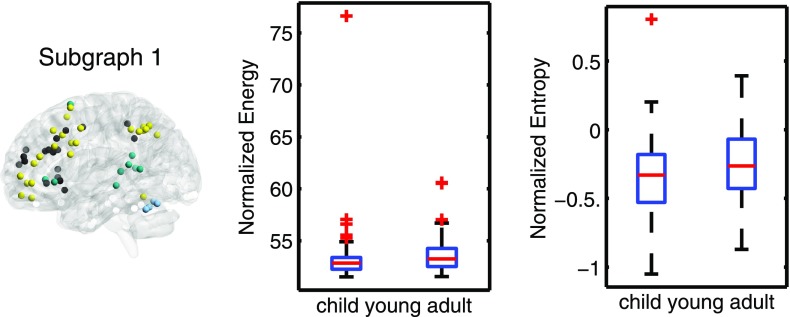
Cognitive function evolves significantly over development, enabling flexible control of human behavior. Yet, how these functions are instantiated in spatially distributed and dynamically interacting networks, or graphs, that change in structure from childhood to adolescence is far from understood. Here we applied a novel machine-learning method to track continuously overlapping and time-varying subgraphs in the brain at rest within a sample of 200 healthy youth (ages 8-11 and 19-22) drawn from the Philadelphia Neurodevelopmental Cohort. We uncovered a set of subgraphs that capture surprisingly integrated and dynamically changing interactions among known cognitive systems. We observed that subgraphs that were highly expressed were especially transient, flexibly switching between high and low expression over time. This transience was particularly salient in a subgraph predominantly linking frontoparietal regions of the executive system, which increases in both expression and flexibility from childhood to young adulthood. Collectively, these results suggest that healthy development is accompanied by an increasing precedence of executive networks and a greater switching of the regions and interactions subserving these networks.
Keywords: Energy; Entropy; Executive function; Flexibility; Matrix factorization; Neurodevelopment; Subgraph.
Conflict of interest statement
Competing Interests: The authors have declared that no competing interests exist.
Figures


Similar articles
-
Evolution of brain network dynamics in early Parkinson's disease with mild cognitive impairment.Cogn Neurodyn. 2023 Jun;17(3):681-694. doi: 10.1007/s11571-022-09868-1. Epub 2022 Aug 17. Cogn Neurodyn. 2023. PMID: 37265660 Free PMC article.
-
Beyond modularity: Fine-scale mechanisms and rules for brain network reconfiguration.Neuroimage. 2018 Feb 1;166:385-399. doi: 10.1016/j.neuroimage.2017.11.015. Epub 2017 Nov 11. Neuroimage. 2018. PMID: 29138087
-
Dissecting molecular network structures using a network subgraph approach.PeerJ. 2020 Aug 6;8:e9556. doi: 10.7717/peerj.9556. eCollection 2020. PeerJ. 2020. PMID: 33005483 Free PMC article.
-
Development and Plasticity of Cognitive Flexibility in Early and Middle Childhood.Front Psychol. 2017 Jun 20;8:1040. doi: 10.3389/fpsyg.2017.01040. eCollection 2017. Front Psychol. 2017. PMID: 28676784 Free PMC article. Review.
-
Grasping frequent subgraph mining for bioinformatics applications.BioData Min. 2018 Sep 3;11:20. doi: 10.1186/s13040-018-0181-9. eCollection 2018. BioData Min. 2018. PMID: 30202444 Free PMC article. Review.
Cited by
-
Development of the Functional Connectome Topology in Adolescence: Evidence from Topological Data Analysis.eNeuro. 2023 Feb 15;10(2):ENEURO.0296-21.2022. doi: 10.1523/ENEURO.0296-21.2022. Print 2023 Feb. eNeuro. 2023. PMID: 36717266 Free PMC article.
-
Of Microbes and Minds: A Narrative Review on the Second Brain Aging.Front Med (Lausanne). 2018 Mar 2;5:53. doi: 10.3389/fmed.2018.00053. eCollection 2018. Front Med (Lausanne). 2018. PMID: 29552561 Free PMC article. Review.
-
Exploring functional brain activity in neonates: A resting-state fMRI study.Dev Cogn Neurosci. 2020 Oct;45:100850. doi: 10.1016/j.dcn.2020.100850. Epub 2020 Aug 27. Dev Cogn Neurosci. 2020. PMID: 32882651 Free PMC article.
-
Unveiling hidden sources of dynamic functional connectome through a novel regularized blind source separation approach.Imaging Neurosci (Camb). 2024 Jul 12;2:imag-2-00220. doi: 10.1162/imag_a_00220. eCollection 2024. Imaging Neurosci (Camb). 2024. PMID: 40800390 Free PMC article.
-
The energy landscape underpinning module dynamics in the human brain connectome.Neuroimage. 2017 Aug 15;157:364-380. doi: 10.1016/j.neuroimage.2017.05.067. Epub 2017 Jun 7. Neuroimage. 2017. PMID: 28602945 Free PMC article.
References
Grants and funding
LinkOut - more resources
Full Text Sources
Other Literature Sources