. 2019 Feb 1;3(2):384-404.
doi: 10.1162/netn_a_00069. eCollection 2019.

Computation is concentrated in rich clubs of local cortical networks

Affiliations

Computation is concentrated in rich clubs of local cortical networks

Samantha P Faber et al. Netw Neurosci. .

Abstract

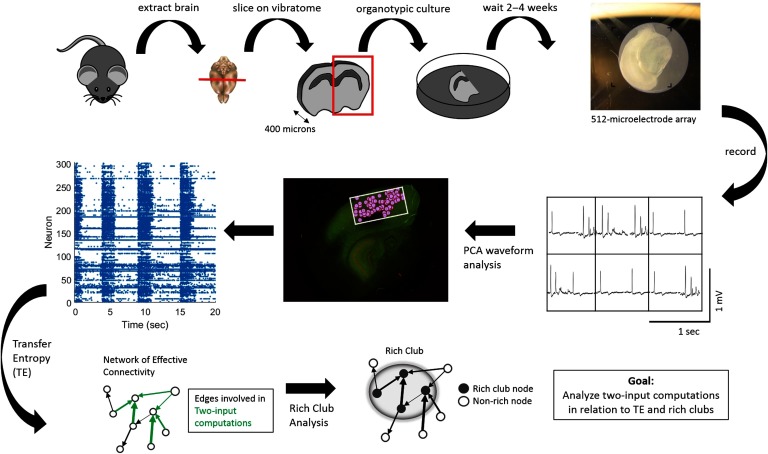
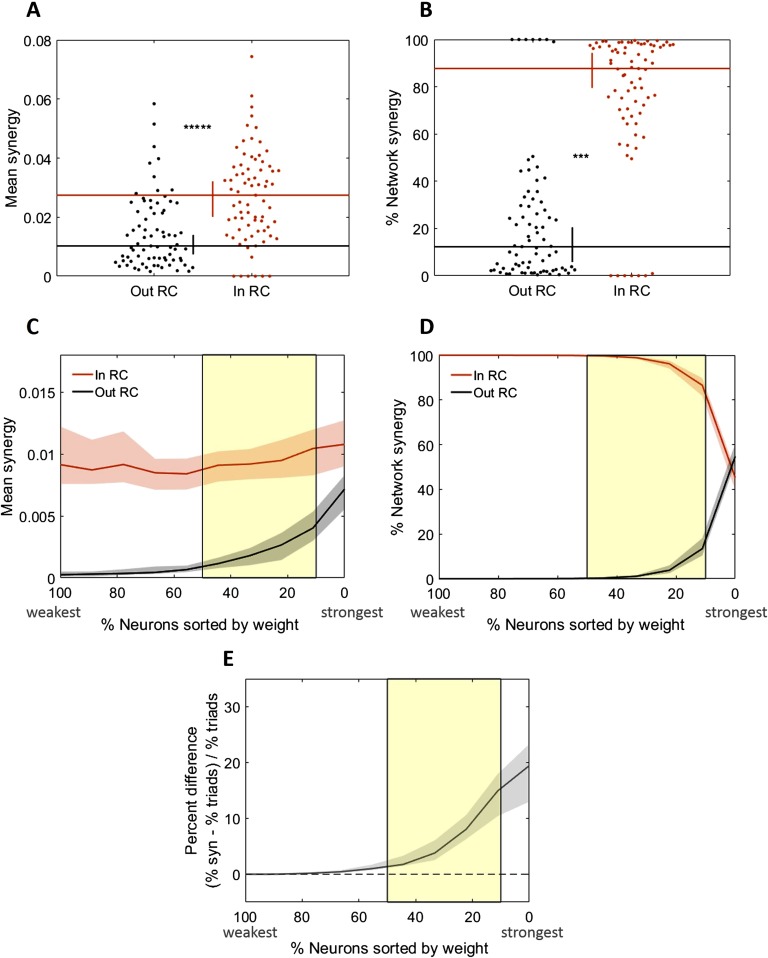
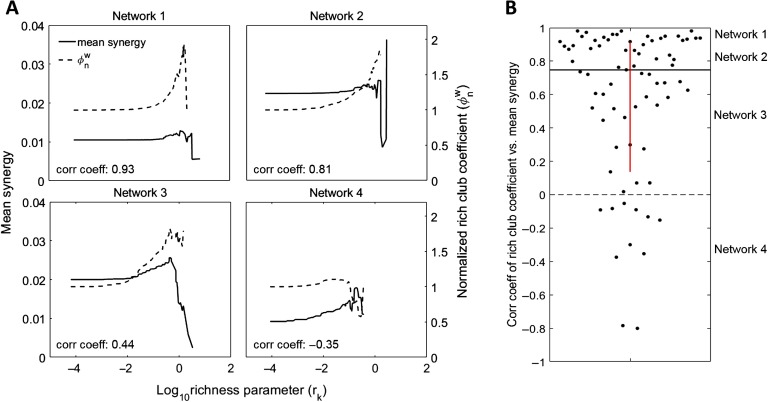
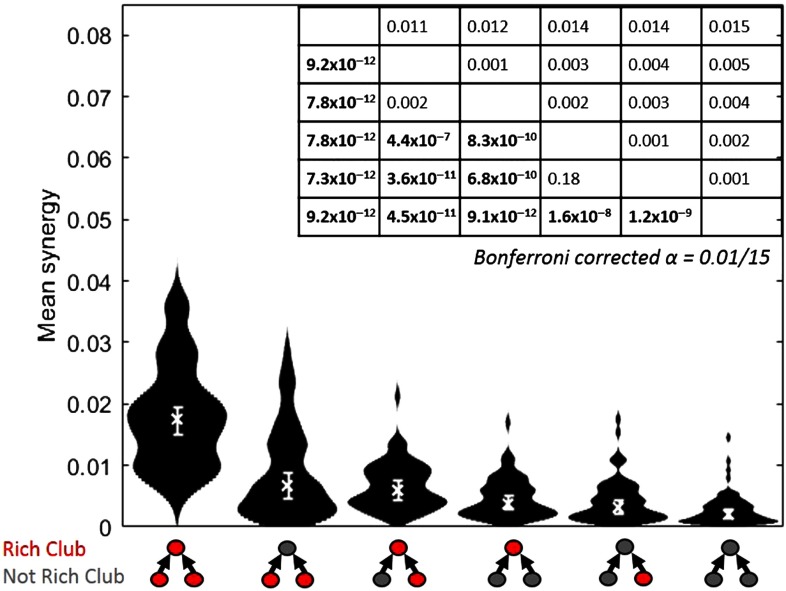
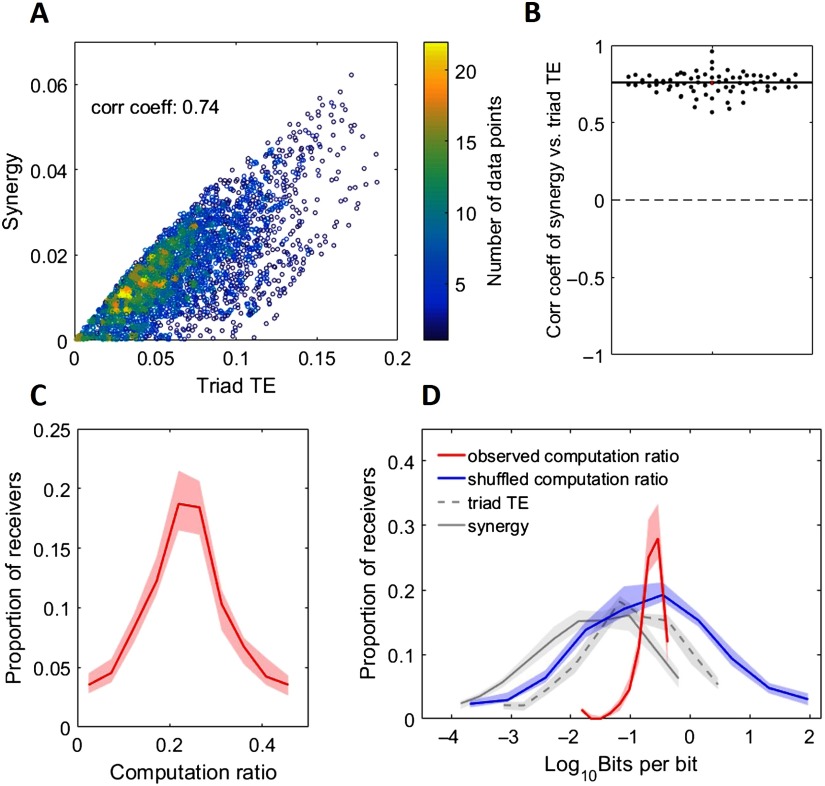
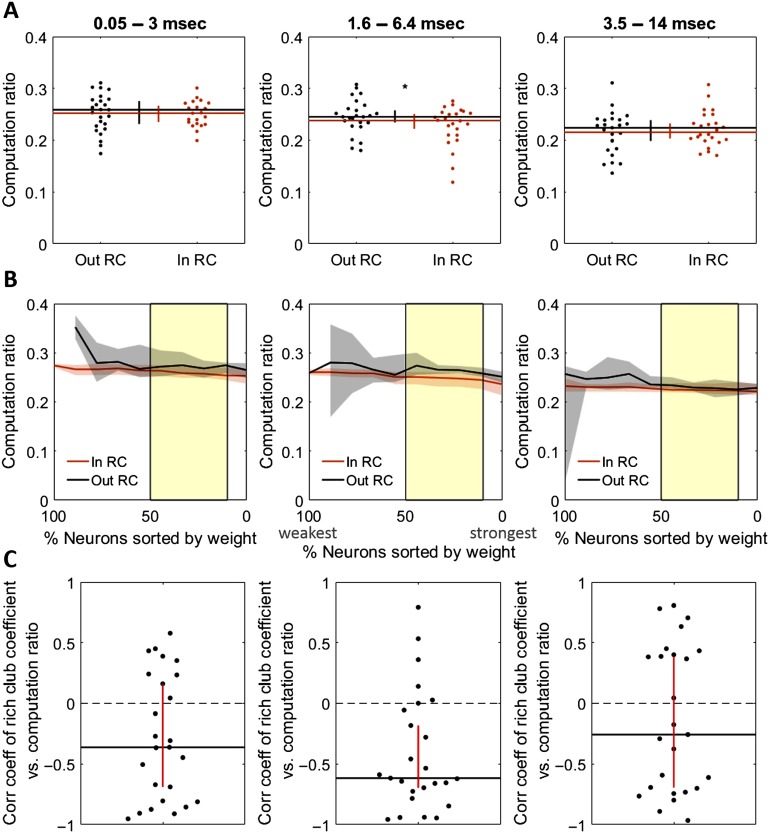
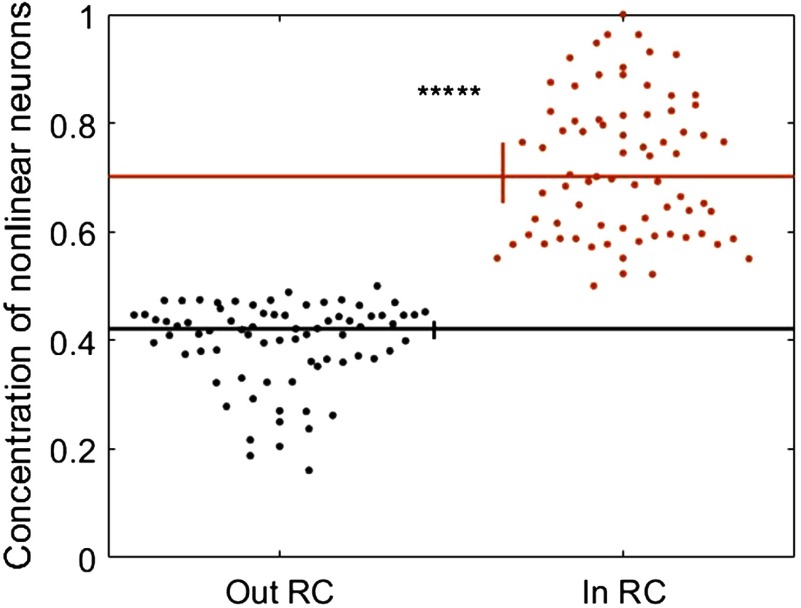
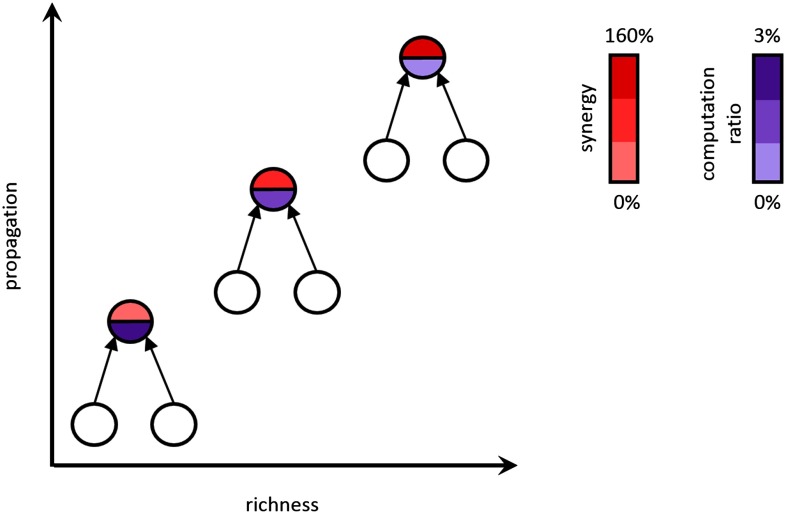
To understand how neural circuits process information, it is essential to identify the relationship between computation and circuit organization. Rich clubs, highly interconnected sets of neurons, are known to propagate a disproportionate amount of information within cortical circuits. Here, we test the hypothesis that rich clubs also perform a disproportionate amount of computation. To do so, we recorded the spiking activity of on average ∼300 well-isolated individual neurons from organotypic cortical cultures. We then constructed weighted, directed networks reflecting the effective connectivity between the neurons. For each neuron, we quantified the amount of computation it performed based on its inputs. We found that rich-club neurons compute ∼160% more information than neurons outside of the rich club. The amount of computation performed in the rich club was proportional to the amount of information propagation by the same neurons. This suggests that in these circuits, information propagation drives computation. In total, our findings indicate that rich-club organization in effective cortical circuits supports not only information propagation but also neural computation.

Keywords: Cortical networks; Effective connectivity; Information theory; Neural computation; Rich clubs; Transfer entropy.


Conflict of interest statement

Competing Interests: The authors have declared that no competing interests exist.

Figures

<b>Figure 1.</b>
Figure 1.
Experimental and data analysis procedure. (Top row, left to right) Brains were extracted from mouse pups and sliced using a vibratome. Slices containing somatosensory cortex were organotypically cultured for up to 2 to 4 weeks. Cultures were then placed on a recording array and recorded for 1 hr. (Middle row, right to left) Recordings yielded neuron-spiking dynamics at each electrode—waveforms at six example electrodes shown—which were sorted using principal component analysis in order to isolate individual cells based on their distinct waveforms. Once cells were isolated and localized (pink circles) within the recording area (white rectangle), their corresponding spike trains could be determined. (Bottom Row, left to right) Spike trains were then used to compute transfer entropy (TE), at multiple timescales, between each neuron pair in a recording. This resulted in networks of effective connectivity. Computations occurring at neurons receiving two connections were then calculated using partial information decomposition. A rich-club analysis was used to detect collections of hub neurons that connect to each other. Finally, we examined the relationship between TE within a triad and two-input computations as well as between two-input computations and rich clubs.
<b>Figure 2.</b>
Figure 2.
Distributions of neuron computation (synergy) and propagation (triad TE) are highly varied. Histograms of synergy and triad TE values for all receivers in all networks at all timescales. (A) Distributions of measured values. (B) Distributions of log-scaled values to emphasize variability. Solid and dashed lines depict the median across networks, and shaded regions depict 95% bootstrap confidence intervals around the median.
<b>Figure 3.</b>
Figure 3.
Networks reliably show rich clubs. (A) Adjacency matrix of a representative 310-neuron network with rich clubs. Rich club of top 30% of neurons depicted. Neurons sorted in order of increasing richness from left to right and bottom to top. TE values are log scaled. (B) Normalized, weighted rich-club coefficients for all networks. X-axis is log-scaled richness parameter level, where the richness parameter is the sum of the weighted connections for each neuron. Solid line represents median across all networks; shaded region is 95% bootstrap confidence interval around the median. In order for a rich club to be recruited into the synergy analysis, coefficients were required to be significant (p < 0.01) when compared with those from randomized networks. (C) The number of networks, out of the 75 analyzed, with significant rich clubs at each threshold. The majority of networks had significant rich clubs composed of the top 50% to 10% of the network.
<b>Figure 4.</b>
Figure 4.
Rich-club neurons compute more than non–rich-club neurons. (A) Triads with receivers in the rich club (RC) have median mean normalized synergy (compute more) than those with receivers outside the rich club. (B) Triads with receivers in the rich club perform a significantly larger percentage of the total network computation than triads with receivers outside the rich club. Distributions shown here are complementary; values sum to 1. (C–E) Comparison of key metrics at all possible rich-club thresholds. The thresholds have been aligned over networks based on the number of neurons in the network that are included at each threshold. The highest (most stringent) thresholds are on the right with the lowest percent of neurons in the rich club. (C) At all significant rich-club levels (indicated by the yellow shaded region), triads with receivers in the rich club have greater median mean synergy than those with receivers outside the rich club. (D) The percentage of network synergy is plotted as a function of rich-club level. At all significant rich-club levels, a greater percentage of network synergy occurs in the rich clubs than outside the rich clubs. Distributions shown here are complementary; values sum to 1. (E) The percent difference in the percentage of network synergy and the percentage of network triads in the rich club is plotted as a function of rich-club level. Positive values reflect a larger relative percentage of synergy than percentage of triads. At all significant rich-club levels, a greater percentage of synergy is accounted for by a smaller percentage of triads in the rich clubs. Significance indicators: *****p < 1 × 10⁻⁹; ***p < 1 × 10⁻⁶.
<b>Figure 5.</b>
Figure 5.
Normalized rich-club coefficient correlates with synergy. (A) Normalized rich-club coefficients and mean normalized synergy at increasing richness levels for four representative networks. Negative correlations are observed in networks that have poor rich clubs, or in which the mean synergy decreases as we consider fewer, richer neurons. The second case is observed in networks whose top neurons participate in many triads with synergy values that are highly variable. (B) Distribution of correlation coefficients for correlations between rich-club coefficients and mean triad synergy at all richness levels. Most network rich-club coefficients are positively correlated with mean triad synergy. This shows that rich clubs are predictive of increased synergy levels.
<b>Figure 6.</b>
Figure 6.
Greater computation (synergy) is performed by triads with greater numbers of neurons in the rich club. Distributions of mean synergy for each of all possible triad interactions with the rich club. Triads that have all members in the rich club have the greatest synergy. Triads with both transmitters in the rich club, and a single transmitter and the receiver in the rich club, have similar amounts of synergy. Triads with only the receiver in the rich club have more synergy than triads with a single transmitter in the rich club. All triads with any member in the rich club have more synergy than triads with no members in the rich club. Medians, denoted by “x,” and 95% bootstrap confidence intervals are shown. Table shows Bonferroni–Holm corrected p values (lower diagonal) and differences of medians (upper diagonal) of pairwise comparisons between the conditions, which are sorted by median mean synergy. Significant p values are boldface. Distributions shown have n = 75 data points.
<b>Figure 7.</b>
Figure 7.
Propagation is highly predictive of computation. (A) Scatterplot of synergy (computation) versus triad TE (propagation) in a representative network with 3,448 triads. Colorbar depicts point density. Also shown is the correlation coefficient. (B) Distribution of network correlations between synergy and triad TE. This shows that computation was strongly, positively correlated with propagation across all networks. (C) Histogram of computation ratio values for all receivers in all networks. (D) Histogram of log-scaled computation ratio values for all receivers in all networks. Gray lines are replotted here from Figure 2 for ease of comparison. The blue line represents the distribution of computation ratios that results from shuffling the alignment of triad synergy to TE. Thus, the span of observed computation ratios is significantly smaller than what we might have observed by chance. For C and D, Solid and dashed lines depict the medians across networks, and shaded regions depict 95% bootstrap confidence intervals around the medians.
<b>Figure 8.</b>
Figure 8.
Rich-club membership is not strongly predictive of the ratio of computation to propagation (computation ratio). (A) Mean computation ratio for triads with receivers inside versus outside the rich club at the 0.05–3 ms timescale (left), the 1.6–6.4 ms timescale (center), and the 3.5–14 ms timescale (right). (B) Computation ratio for triads with receivers inside versus outside the rich club at all significant rich club levels (indicated by the yellow shaded region) at the 0.05–3 ms timescale (left), the 1.6–6.4 ms timescale (center), and the 3.5–14 ms timescale (right). (C) Coefficient distribution for correlations between mean computation ratio and normalized rich-club coefficient at all richness levels, for each network, at the 0.05–3 ms timescale (left), the 1.6–6.4 ms timescale (center), and the 3.5–14 ms timescale (right). Significance indicators: *p < 0.05.
<b>Figure 9.</b>
Figure 9.
Alternative measure of neural computation reveals results that correspond to those obtained using PID. Neurons with nonlinear transfer functions are represented more inside rich clubs than they are outside rich clubs. Significance indicators: *****p < 1 × 10⁻⁹.
<b>Figure 10.</b>
Figure 10.
Summary of major findings. Synergy (computation) increases with propagation and node richness by an average of 160%, and the computation ratio (amount of computation performed relative to propagation) decreases by 3%.

References

    1. Adamatzky A., & Durand-Lose J. (2012). Collision-based computing In Rozenberg G., Bäck T., & Kok J. N. (Eds.), Handbook of Natural Computing (pp. 1949–1978). Berlin: Springer.
    1. Beggs J. M., & Plenz D. (2004). Neuronal avalanches are diverse and precise activity patterns that are stable for many hours in cortical slice cultures. Journal of Neuroscience, 24, 5216–5229. - PMC - PubMed
    1. Bertschinger N., Rauh J., Olbrich E., Jost J., & Ay N. (2014). Quantifying unique information. Entropy, 16(4), 2161–2183.
    1. Bhattacharjee K., Naskar N., Roy S., & Das S. (2016). A survey of cellular automata: Types, dynamics, non-uniformity and applications. arXiv:1607.02291.
    1. Bolz J., Novak N., Götz M., & Bonhoeffer T. (1990). Formation of target-specific neuronal projections in organotypic slice cultures from rat visual cortex. Nature, 346, 359–362. - PubMed