. 2019 Feb 1;3(2):455-474.
doi: 10.1162/netn_a_00072. eCollection 2019.

Centralized and distributed cognitive task processing in the human connectome

Affiliations

Centralized and distributed cognitive task processing in the human connectome

Enrico Amico et al. Netw Neurosci. .

Abstract

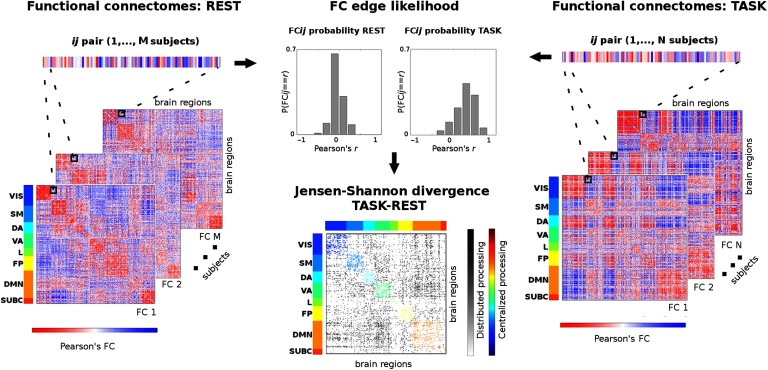
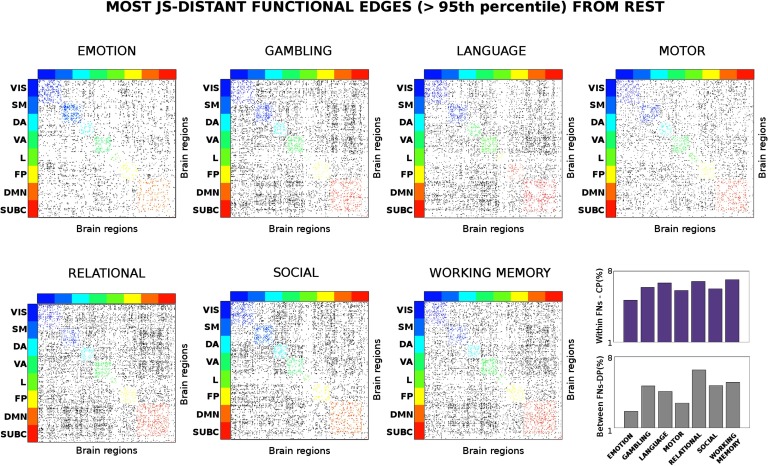
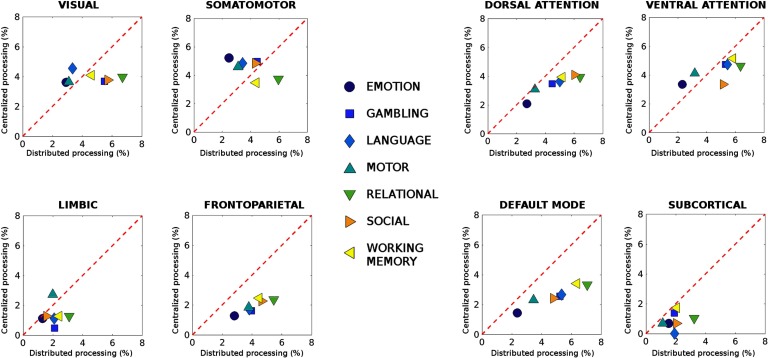
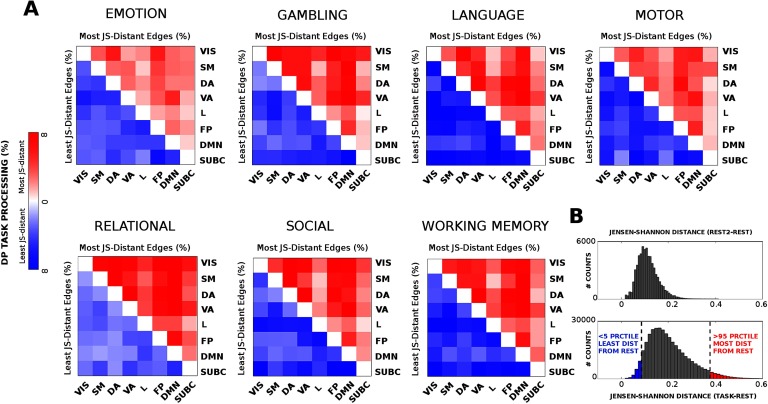
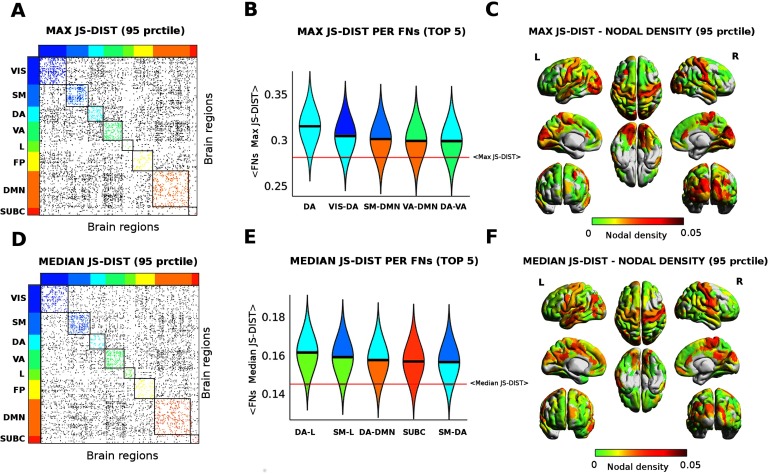
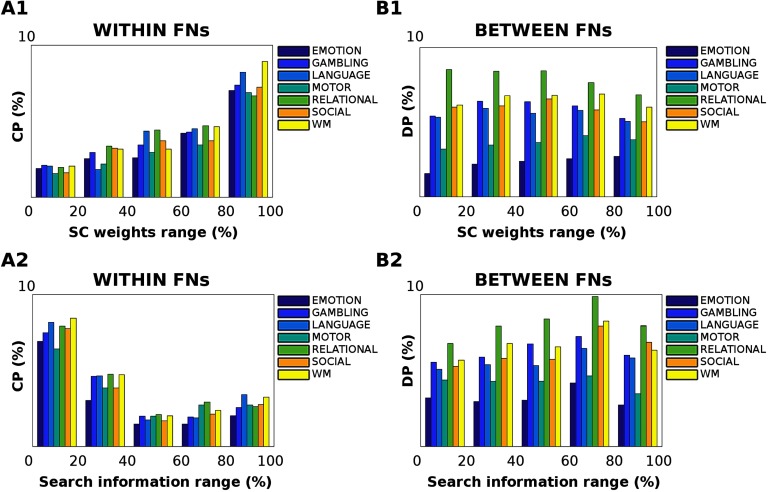
A key question in modern neuroscience is how cognitive changes in a human brain can be quantified and captured by functional connectivity (FC). A systematic approach to measure pairwise functional distance at different brain states is lacking. This would provide a straightforward way to quantify differences in cognitive processing across tasks; also, it would help in relating these differences in task-based FCs to the underlying structural network. Here we propose a framework, based on the concept of Jensen-Shannon divergence, to map the task-rest connectivity distance between tasks and resting-state FC. We show how this information theoretical measure allows for quantifying connectivity changes in distributed and centralized processing in functional networks. We study resting state and seven tasks from the Human Connectome Project dataset to obtain the most distant links across tasks. We investigate how these changes are associated with different functional brain networks, and use the proposed measure to infer changes in the information-processing regimes. Furthermore, we show how the FC distance from resting state is shaped by structural connectivity, and to what extent this relationship depends on the task. This framework provides a well-grounded mathematical quantification of connectivity changes associated with cognitive processing in large-scale brain networks.

Keywords: Brain connectomics; Cognitive task processing; Functional connectivity; Information theory; Network science.


Conflict of interest statement

Competing Interests: The authors have declared that no competing interests exist.

Figures

<b>Figure 1.</b>
Figure 1.
Workflow scheme for task-rest connectivity distance (unpaired). This scheme summarizes the procedure to measure edgewise distance from two cohorts of (M and N) functional connectomes (FCs) at rest (left) to a task-based one (right). First, an edge ij is extracted from the set, for both the resting-state and task-based FCs; these two vectors of M and N connectivity values are then transformed into probability distributions (center top); finally, the Jensen-Shannon distance for these two edgewise probabilities is computed (center bottom). Iterating this procedure over all possible ij pairs gives a Jensen-Shannon (JS) matrix of local distance in task FCs with respect to the REST baseline. The JS matrix is ordered by the seven functional networks (FNs): visual (VIS), somatomotor (SM), dorsal attention (DA), ventral attention (VA), limbic (L), frontoparietal (FP), and default mode network (DMN). An eighth subcortical network (SUBC) is added for completeness. Within-network most distant edges are color coded according to FNs. Between-network most distant edges are in gray scale. This method allows for quantifying the changes between centralized (within-network) and distributed (between-network) processing when a specific task is performed with respect to the resting-state baseline.
<b>Figure 2.</b>
Figure 2.
Connectivity distance across different tasks. Evaluation of the most distant functional links (in terms of Jensen-Shannon [JS] distance; see Methods) across seven different task sessions. The JS matrices were thresholded at the 95th percentile of the distribution of JS values across the seven tasks. The JS matrices were then ordered by seven functional networks (FNs; Yeo et al., 2011); visual (VIS), somatomotor (SM), dorsal attention (DA), ventral attention (VA), limbic (L), frontoparietal (FP), and default mode network (DMN). An eight subcortical network (SUBC) was added for completeness. The edges surviving the threshold corresponding to within-FN connections are color-coded accordingly. Edges corresponding to between-FN connections are depicted in gray scale. Note how the connectivity distance depends on the task: in some cases within-FN connectivity is more recruited (i.e., for the emotion task), in other between-FN connections are the most distant (i.e., relational task). The bottom-right bar plots depict the average percentage of within-FN most distant edges, i.e., centralized processing (CP, violet bars) and the average percentage of between-FN edges, that is, distributed processing (DP, gray bars) across the different tasks.
<b>Figure 3.</b>
Figure 3.
Centralized and distributed task processing in functional connectomes. Each plot shows differences in centralized versus distributed processing (see Methods) for each of the seven functional networks (FNs; visual, somatomotor, dorsal and ventral attention, limbic, frontoparietal, and DMN; Yeo et al., 2011) and subcortical network, for all seven different HCP tasks. The difference in centralized processing with respect to resting state was defined as the number of most Jensen-Shannon (JS) distant edges within-FN divided by the total number of edges in the FN (reported as percentage). Similarly, deviations from distributed processing in resting state were defined as the number of most JS-distant edges between FN divided by the total number of between-FN connections. Note how FP and DMN networks deviate from rest mainly in the amount of distributed processing, that is, between-FN connectivity.
<b>Figure 4.</b>
Figure 4.
Least and most distant edges per functional network across tasks. (A) Heat maps, for all seven fMRI tasks evaluated, showing the most (red, upper triangular) and least (blue, lower triangular) distributed processing (DP) values between pairs of functional networks with respect to REST. (B) Top: distribution of JS-distance values when comparing REST2 session to the baseline REST session. Bottom: distribution of Jensen-Shannon distance values across the seven tasks evaluated. The tails of the histogram are highlighted in blue (least distant edges, < 5th percentile) and red (most distant edges, > 95th percentile).
<b>Figure 5.</b>
Figure 5.
Functional reconfiguration via Jensen-Shannon distance. (A–D) Edgewise max (A) and median (D) Jensen-Shannon distance across all tasks (thresholded by 95th percentiles for max and for median). The colored dots depict JS values within FNs; gray dots indicate significant JS-distant edges between FNs. (B–E) Violin plot of edgewise JS distance (max and median) for the top five FNs and FN interactions. Within-FNs are color coded accordingly (as in A–D), while between-FNs are color coded using the colors of the two FNs involved. Solid black lines depict median values of each distribution; solid red lines indicate the whole-brain median value of max and median distributions. (C–F) Brain render of max and median JS distances as nodal density per region. The strength per brain region computed as sum of JS distance (max and median) for functional edges above the 95 percentile threshold divided by the total number of brain regions.
<b>Figure 6.</b>
Figure 6.
Effect of structural pathways on centralized and distributed processing changes. (A1–B1) The relationship between the anatomical connections and Jensen-Shannon distance was evaluated across the seven different tasks. The bar plots show the percentage of centralized processing (CP) within functional networks (FNs, A1) and distributed processing (DP) between FNs (B1), per five different percentile ranges of structural connectivity weights: 0–20, 20–40, 40–60, 60–80, and 80–100. The percentile range was extracted from the group-averaged structural connectome. Note how, for within-FN connections (A1), the change in centralized processing significantly correlates with the strength of structural connections across all tasks (one-way ANOVA F = 163.39, df = 4, p = 6.62 ⋅ 10−20); conversely, the underlying structural connectivity does not play a major role in distributed processing changes (one-way ANOVA F = 1.11, df = 4, p = 0.37). (A2–B2) The effect of structural path accessibility (as measured by search information; see Methods) on centralized and distributed processing was tested across the seven different tasks, per five different percentile intervals of search information: 0–20, 20–40, 40–60, 60–80, and 80–100. The percentile range was extracted from the group-averaged search information matrix. Notably, changes in centralized processing (A2) are significantly associated with low values of search information (one-way ANOVA F = 131.75, df = 4, p = 1.41 ⋅ 10−18); conversely, no significant association between SI and distributed processing changes was found (one-way ANOVA F = 1.85, df = 4, p = 0.14).

References

    1. Amico E., Arenas A., & Goñi J. (2019). Supporting information for “Centralized and distributed cognitive task processing in the human connectome.” Network Neuroscience, 3(2), 455–474. - PMC - PubMed
    1. Amico E., & Goñi J. (2018). Mapping hybrid functional-structural connectivity traits in the human connectome. Network Neuroscience, 2(3), 306–322. - PMC - PubMed
    1. Amico E., Marinazzo D., Di Perri C., Heine L., Annen J., Martial C., … Goñi J. (2017). Mapping the functional connectome traits of levels of consciousness. NeuroImage, 148, 201–211. - PubMed
    1. Andersson J. L. R., Skare S., & Ashburner J. (2003). How to correct susceptibility distortions in spin-echo echo-planar images: Application to diffusion tensor imaging. NeuroImage, 20(2), 870–888. - PubMed
    1. Barch D. M., Burgess G. C., Harms M. P., Petersen S. E., Schlaggar B. L., Corbetta M., … Van Essen D. C. (2013). Function in the human connectome: Task-fMRI and individual differences in behavior. NeuroImage, 80, 169–189. - PMC - PubMed

LinkOut - more resources