. 2019 May 7;47(8):e46.
doi: 10.1093/nar/gkz107.

Using long-read sequencing to detect imprinted DNA methylation

Affiliations

Using long-read sequencing to detect imprinted DNA methylation

Scott Gigante et al. Nucleic Acids Res. .

Abstract

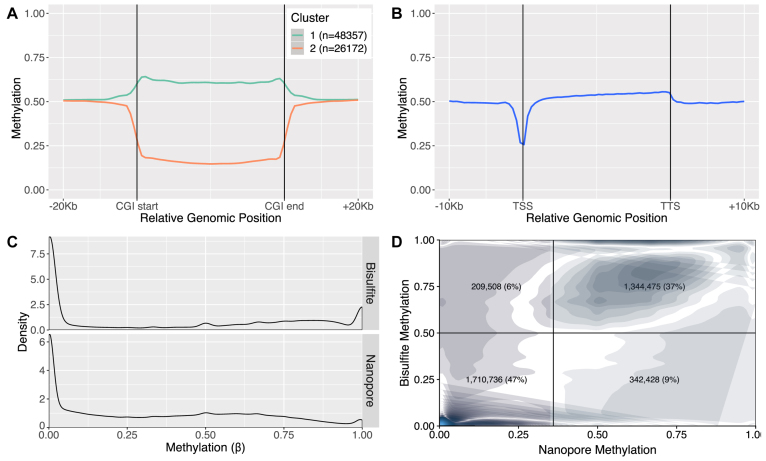
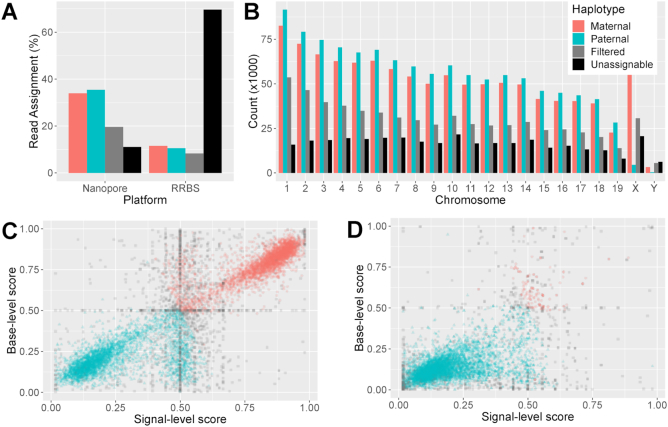
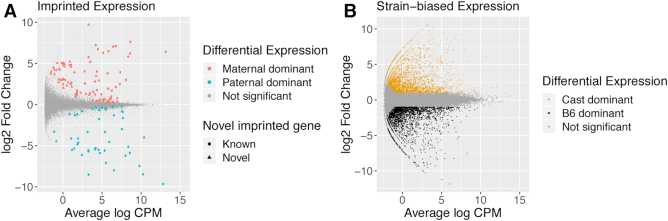
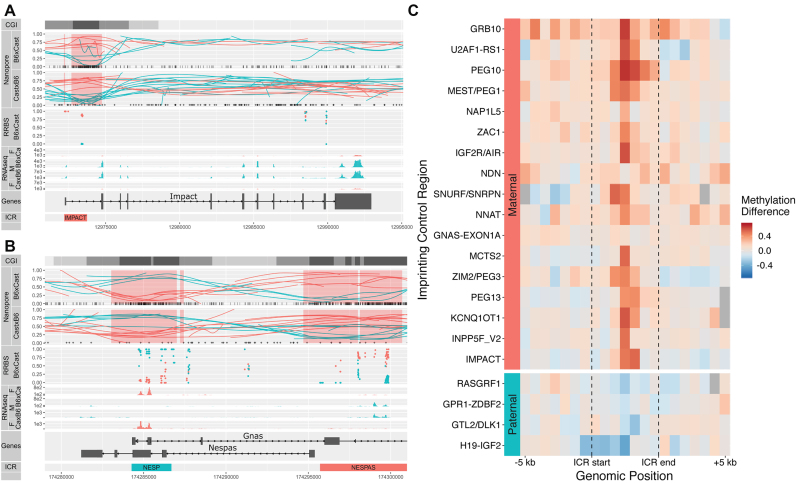
Systematic variation in the methylation of cytosines at CpG sites plays a critical role in early development of humans and other mammals. Of particular interest are regions of differential methylation between parental alleles, as these often dictate monoallelic gene expression, resulting in parent of origin specific control of the embryonic transcriptome and subsequent development, in a phenomenon known as genomic imprinting. Using long-read nanopore sequencing we show that, with an average genomic coverage of ∼10, it is possible to determine both the level of methylation of CpG sites and the haplotype from which each read arises. The long-read property is exploited to characterize, using novel methods, both methylation and haplotype for reads that have reduced basecalling precision compared to Sanger sequencing. We validate the analysis both through comparison of nanopore-derived methylation patterns with those from Reduced Representation Bisulfite Sequencing data and through comparison with previously reported data. Our analysis successfully identifies known imprinting control regions (ICRs) as well as some novel differentially methylated regions which, due to their proximity to hitherto unknown monoallelically expressed genes, may represent new ICRs.


Figures

Figure 1.
Figure 1.
Nanopore methylation calls are consistent with expected results and established technologies. (A) Metaplot of nanopore methylation calls across CGIs, clustered in two groups of high and low methylation. (B) Metaplot of nanopore methylation calls across the aggregated gene bodies of all protein-coding genes recapitulated known methylation structures. (C) Density of methylation calls (β, the average methylation based on all reads covering that position) for sites covered by both nanopore and RRBS. (D) Joint density of nanopore and RRBS methylation calls for the same sites as in panel (C). Darker regions indicate regions of higher density, while lighter regions indicate regions of lower density. The density plot is split into four quadrants according to a RRBS threshold of 0.5 and a nanopore threshold of 0.36, and the percentage of sites in each quadrant is displayed.
Figure 2.
Figure 2.
Accurate and efficient haplotyping of nanopore reads. (A) Percentages of mapped reads from RRBS and nanopore sequencing that were assigned to the B6 genome (maternal), Cast genome (paternal), or that could not be haplotyped (filtered) for the B6 × Cast F1 sample. (B) Percentages of mapped reads from nanopore sequencing that were assigned to each haplotype on each chromosome. (C) Scatter plot of haplotype scores for nanopore reads according to signal (x-axis) and basecall (y-axis) methods. Only 10 000 randomly selected reads are shown for ease of visualization. (D) Signal and basecall haplotype scores for reads from the sequencing of the pure parental Cast strain.
Figure 3.
Figure 3.
Differential allelic expression in mouse E14.5 embryonic placenta. (A) Differential expression between the maternal and paternal alleles. Genes with adjusted P-value < 0.1 are coloured in red when maternal expression dominates (positive log-fold change) and blue when paternal expression is greater (negative log-fold change). The shape of the point indicates whether the differentially expressed gene has previously been reported as imprinted. (B) Differential expression between B6 and Cast alleles. Genes with adjusted P-value < 0.05 and absolute log2 fold-change > 1 are coloured in black when B6 expression is higher and orange when Cast expression is higher. Interactive plots are available at bioinf.wehi.edu.au/haplotyped_methylome.
Figure 4.
Figure 4.
Nanopore allele-specific methylation captures known differential methylation at ICRs. (A) Allelic methylation plot of maternally imprinted gene Impact displays a clear DMR at its ICR. Haplotyped RRBS data shows concordance with nanopore allelic methylation. Allele-specific RNA-seq coverage plots show monoallelic paternal expression. CGIs are displayed in black, with CpG shores in dark grey and CpG Shelves in light grey. Nanopore: Vertical bars at the base of the B6Cast track denote CpG sites used for methylation calling, while ‘+’ signs at the base of the CastB6 track denote SNPs used for haplotyping. Highlighted red regions indicate DMRs detected by DSS. The maternal allele is shown in red and the paternal allele in cyan for all plots. (B) Allelic methylation plot as in A for the reciprocally imprinted genes Nespas and Gnas. RNA-seq gives very low expression and is not shown. (C) Heatmap of differences (maternal − paternal) in allelic methylation in relative-width bins along known ICRs. Regions are sorted in order of average methylation difference, with regions in the same imprinting cluster placed adjacent to each other. Regions without haplotyped calls for both alleles are shown in grey.
Figure 5.
Figure 5.
Proximity of differentially expressed genes to DMRs. (A) Distribution of distance from genes to imprinted DMRs, shown on a log-scale. Inset shows distances from 0 to 10 000 bp on a linear scale. Imprinted genes are much more frequently located within 100–100 000 bp of an imprinted DMR. (B) Distribution of distance from genes to strain-specific DMRs. Strain-biased genes are for the most part located no closer to a strain-specific DMR than non-differentially expressed genes, indicating the strain-specific differential expression is likely caused by other factors, such as genomic differences. In both cases, we use only DMRs ranked in the top 400.
Figure 6.
Figure 6.
Examples of de novo DMRs and the advantages proffered by long reads. (A) Allelic methylation (as in Figure 4) plot of maternally imprinted gene Peg10 displayed a clear DMR at its ICR, which was much wider than the previously annotated DMR (bottom). (B) Previously uncharacterized secondary DMR at the TSS of maternally imprinted gene Jade1. (C) Novel maternally imprinted gene AC158554.1, with imprinted methylation at its TSS. (D) Allelic methylation plot of maternally imprinted gene Peg3 showed consistently high methylation across some maternal reads, and consistently low methylation across others, a conclusion that could not be drawn from the middling bisulfite methylation values. (E) Strain-of-origin DMR associated with the strain-biased expression of 493342110Rik. (F) DMR associated with the omission of a IAPEZ repeat from the Cast genome, suggesting that the methylation in the flanking region was affected by the presence or absence of the repeat.

References

    1. Ferguson-Smith A.C., Sasaki H., Cattanach B.M., Surani M.A.. Parental-origin-specific epigenetic modification of the mouse H19 gene. Nature. 1993; 362:751–755. - PubMed
    1. Stöger R., Kubicka P., Liu C.G., Kafri T., Razin A., Cedar H., Barlow D.P.. Maternal-specific methylation of the imprinted mouse Igf2r locus identifies the expressed locus as carrying the imprinting signal. Cell. 1993; 73:61–71. - PubMed
    1. Bartolomei M.S., Webber A.L., Brunkow M.E., Tilghman S.M.. Epigenetic mechanisms underlying the imprinting of the mouse H19 gene. Genes Dev. 1993; 7:1663–1673. - PubMed
    1. Li E., Beard C., Jaenisch R.. Role for DNA methylation in genomic imprinting. Nature. 1993; 366:362–365. - PubMed
    1. Ferguson-Smith A.C. Genomic imprinting: the emergence of an epigenetic paradigm. Nat. Rev. Genet. 2011; 12:565–575. - PubMed

Publication types