. 2019 Apr;73(4):675-688.
doi: 10.1111/evo.13701. Epub 2019 Feb 28.

Individual- versus group-optimality in the production of secreted bacterial compounds

Affiliations

Individual- versus group-optimality in the production of secreted bacterial compounds

Konstanze T Schiessl et al. Evolution. 2019 Apr.

Abstract

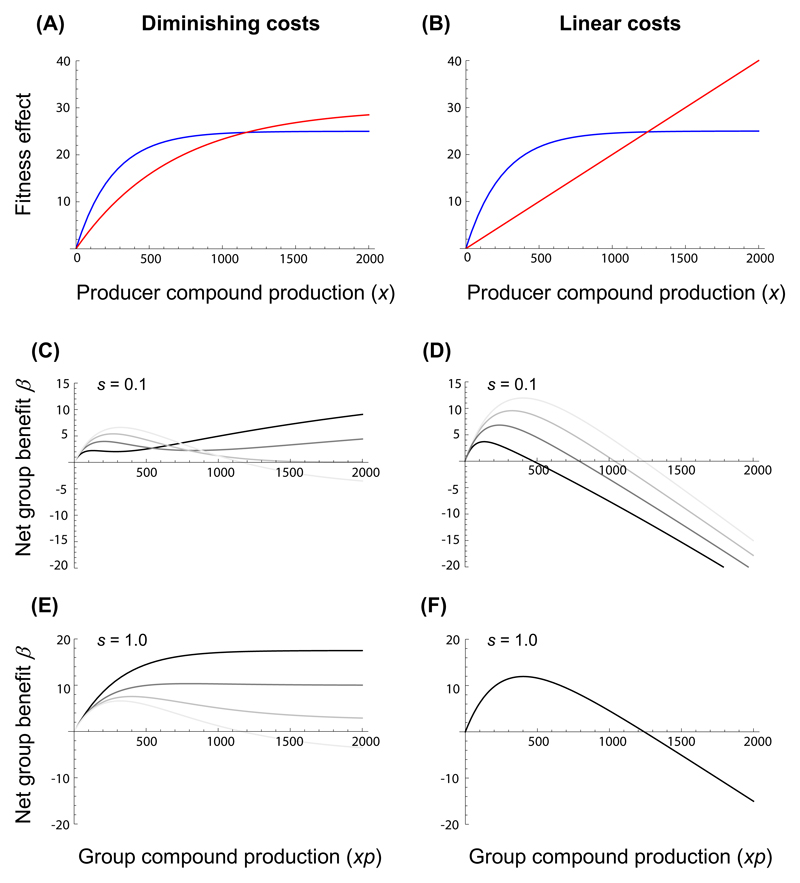
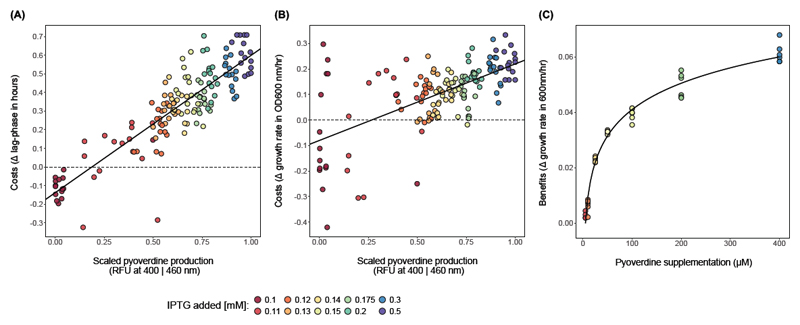
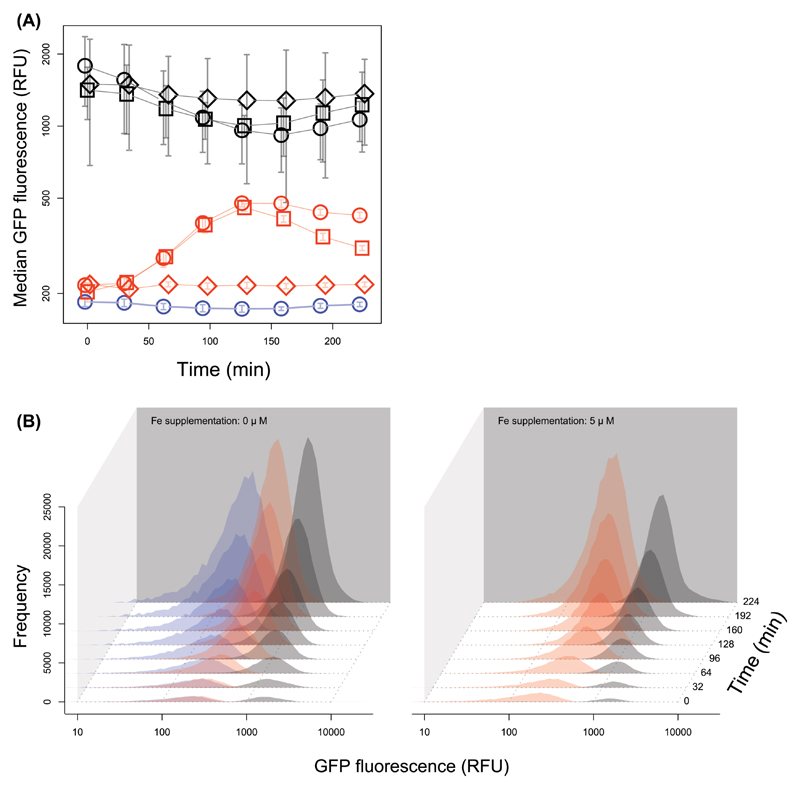
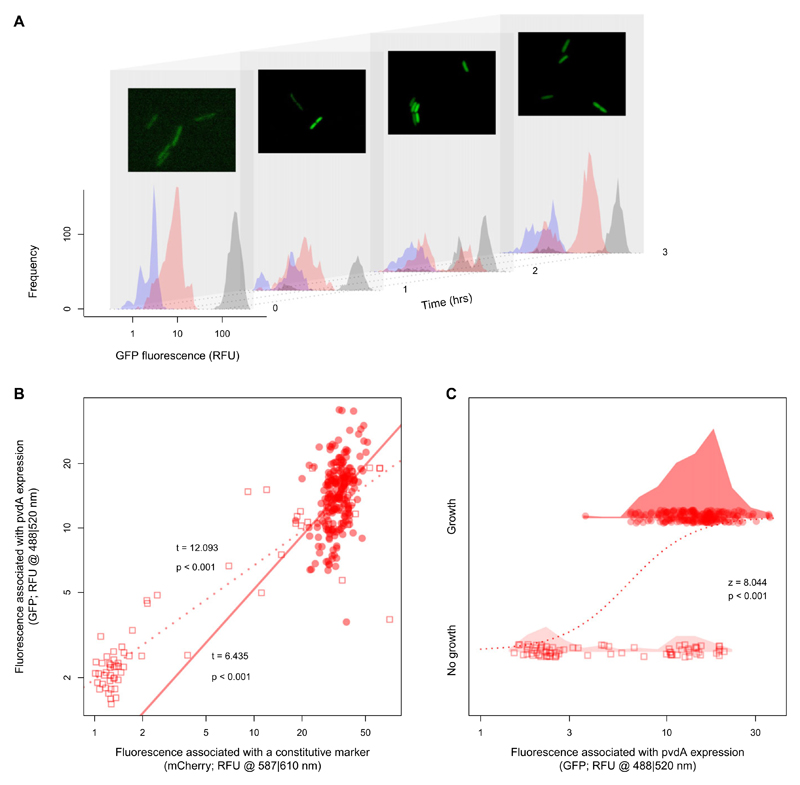
How unicellular organisms optimize the production of compounds is a fundamental biological question. While it is typically thought that production is optimized at the individual-cell level, secreted compounds could also allow for optimization at the group level, leading to a division of labor where a subset of cells produces and shares the compound with everyone. Using mathematical modeling, we show that the evolution of such division of labor depends on the cost function of compound production. Specifically, for any trait with saturating benefits, linear costs promote the evolution of uniform production levels across cells. Conversely, production costs that diminish with higher output levels favor the evolution of specialization-especially when compound shareability is high. When experimentally testing these predictions with pyoverdine, a secreted iron-scavenging compound produced by Pseudomonas aeruginosa, we found linear costs and, consistent with our model, detected uniform pyoverdine production levels across cells. We conclude that for shared compounds with saturating benefits, the evolution of division of labor is facilitated by a diminishing cost function. More generally, we note that shifts in the level of selection from individuals to groups do not solely require cooperation, but critically depend on mechanistic factors, including the distribution of compound synthesis costs.

Keywords: Bacteria; division of labor; economy of scales; group level selection; optimal production; siderophores.


Figures

Figure 1
Figure 1. The net benefit to a group of bacteria producing a shared compound in relation to absolute compound production costs, shareability and the proportion of producers within the group.
Panels A and B show examples of a diminishing and a linear absolute compound cost function C (red lines), respectively, in relation to a saturating gross benefit function B for producers (blue lines) assuming shareability s = 0. Panels C - F depict the resulting net benefit β = B - C to the group as a function of group compound production (xp), for different values of compound shareability s and degrees of production specialization p (grey shaded lines) among cells within the group: (C) diminishing costs and low shareability; (D) linear costs and low shareability; (E) diminishing costs and high shareability; (F) linear costs and high shareability. Grey shaded lines indicate scenarios for different proportions of producers, ranging from p = 1 (faint grey line), to p = 0.75 (light intermediate grey line), to p = 0.5 (dark intermediate grey line), to p = 0.25 (dark grey line). Note that maximum net group benefits equal single-cell optima for p = 1.
Figure 2
Figure 2. Cost and benefit functions of pyoverdine production.
Costs were measured by inducing pyoverdine production in strain PAO1-pvdSi by the addition of increasing concentrations of IPTG under conditions where it is not required for growth. (A) shows costs detectable as increased lag phase, and (B) shows costs detectable as decreased growth rate. The pyoverdine peak value was normalized to the pyoverdine peak at maximum induction (0.5 mM IPTG). For both lag phase and growth rate costs, a linear function was the best fit, as indicated in the graphs (lag-phase: F1,146 = 499.5, R2 = 0.772, p < 0.0001; growth rate: F1,146 = 90.9, R2 = 0.379, p < 0.0001). To quantify benefits, purified pyoverdine was added to cultures of non-induced PAO1-pvdSi under iron-depleted conditions (C). We measured the increase in maximal growth rate (relative to unsupplemented conditions) as a function of pyoverdine supplementation. Here a logarithmic function (y = 0.01372 * log(x) -0.02216, AIC = -345.4) explained more variance than either a linear (AIC = -252.8), quadratic (AIC = -285.7), or an exponential (AIC = -299.1) fit. Cost and benefit functions cannot directly be overlaid because the assays occurred in CAA media with different iron concentrations, affecting the absolute growth rate and fitness measurements (on the y-axis). However, the x-axis range is comparable for both assays, assuming that 0.5 mM IPTG induces nearly maximal pyoverdine production and knowing that P. aeruginosa maximally produces around 300 µM pyoverdine in strongly iron-limited CAA over 24 hours (Dumas et al. 2013).
Figure 3
Figure 3. Tuning of pyoverdine expression in response to iron availability and time.
(A) Population-level median GFP expression over time for the pvdA-gfp reporter (red lines) and a control strain constitutively expressing GFP (grey lines) under different iron supplementation regimes (circles = 0 µM iron added, squares = 5 µM iron added, diamonds = 20 µM iron added). The blue line depicts background fluorescence signal of the wildtype PAO1 strain without reporter. (B) shows the distributions of individual-level GFP expression of the pvdA-gfp reporter (red), the constitutive gfp reporter (grey), and the wildtype control (blue) for the 0 µM and 5 µM iron supplementation regimes, respectively. While the data indicate that the absolute level of pyoverdine expression is extremely fine-tuned in response to iron availability and over time, in all cases the observed values are clearly unimodally distributed.
Figure 4
Figure 4. Microscopy confirms unimodal pvdA expression among growing cells.
(A) Histograms show distributions of individual-level GFP expression of the pvdA-gfp reporter (red), the constitutive gfp reporter (grey), and the wildtype strain without gfp reporter (blue) over time. Microscopy pictures show representative snapshots of the PAO1pvdA-gfp strain (brightness and contrast were adjusted manually). Data reveal a significant increase in bimodality in pyoverdine expression over time (linear increase of Hartigan’s Dn, diptest for bimodality (Maechler and Ringach 2013), for the pvdA-gfp reporter: t66 = 2.85, p = 0.006, but neither for the constitutive gfp reporter control: t66 = 1.16, p = 0.249, nor for the wildtype strain without gfp: t66 = -0.94, p = 0.352). However, (B) fluorescence from expression of a constitutive mcherry control marker served as a significant linear predictor of fluorescence from expression of pyoverdine (pvdA-gfp) both for growing (filled circles) and non-growing cells (empty squares). This suggests that pyoverdine expression levels are linked to the overall cellular gene expression activity. (C) Bimodality in pvdA-gfp expression is only observed among non-growing cells (squares), but was absent among dividing cells (circles; ≥ 2 divisions observed within four hours) (Dn = 0.024, p = 0.485). This indicates that bimodality in pyoverdine expression at the whole population level is mainly driven by bistability in the growth status of cells (dashed line: significant logistic regression between a cell’s pyoverdine (pvdA-gfp) expression and its growth status). Shaded areas show density functions of pvdA-gfp expression levels.
Figure 5
Figure 5. The expression of pvdA is also unimodal when cells grow in a spatially structured environment.
Histograms show distributions of individual-level GFP expression of the pvdA-gfp reporter (red) over time. Cells were inoculated at low density onto agarose pads and their growth and individual pvdA expression was tracked over time using automated time-lapse microscopy. Data show gene expression profiles in 15-minutes intervals, starting from 90 minutes after the start of the experiment.

References

    1. Ackermann M. A functional perspective on phenotypic heterogeneity in microorganisms. Nature Publishing Group. 2015;13:497–508. - PubMed
    1. Ackermann M, Stecher B, Freed NE, Songhet P, Hardt W-D, Doebeli M. Self-destructive cooperation mediated by phenotypic noise. Nature. 2008;454:987–990. - PubMed
    1. Allen B, Gore J, Nowak MA. Spatial dilemmas of diffusible public goods. eLife. 2013;2:1–11. - PMC - PubMed
    1. Alon U. Network motifs: theory and experimental approaches. Nat Rev Genet. 2007;8:450–461. - PubMed
    1. Asfahl KL, Schuster M. Social interactions in bacterial cell–cell signaling. FEMS Microbiol Rev. 2017;41:92–107. - PubMed

Publication types

MeSH terms