

Trabecular architecture of the great ape and human femoral head
- PMID: 30793309
- PMCID: PMC6481414
- DOI: 10.1111/joa.12957
Trabecular architecture of the great ape and human femoral head
Abstract
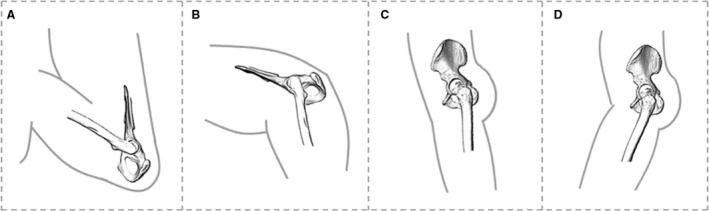
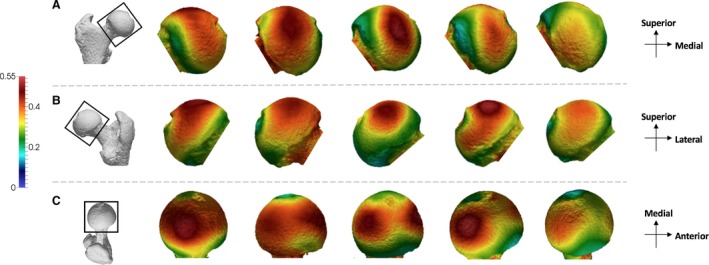
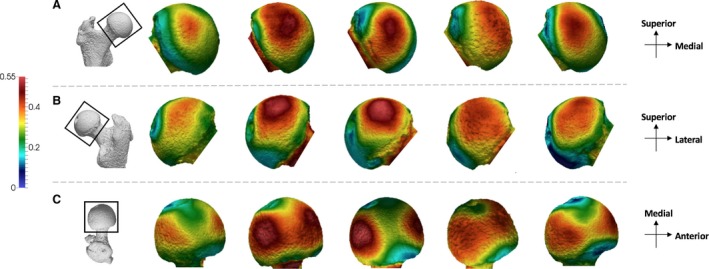
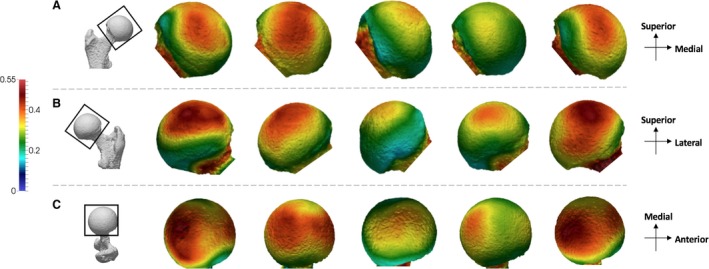
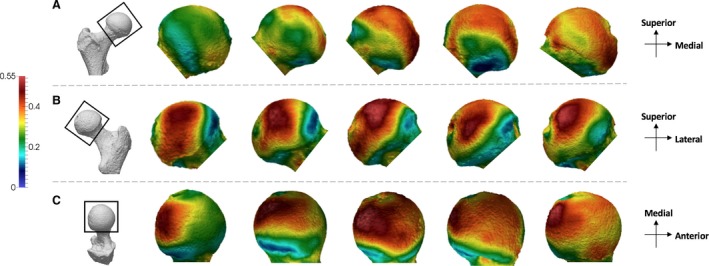
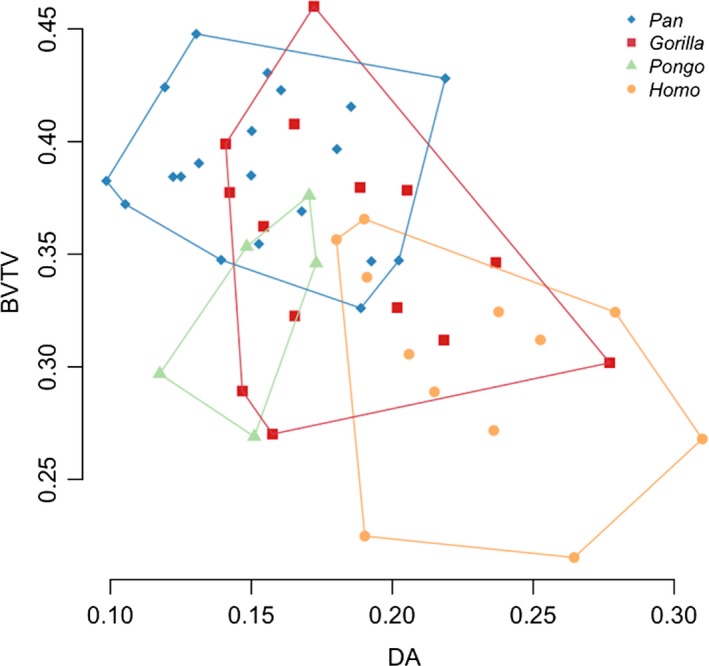
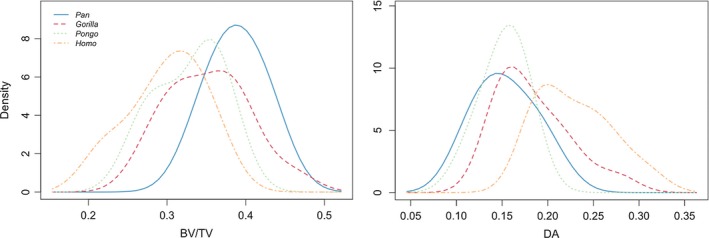
Studies of femoral trabecular structure have shown that the orientation and volume of bone are associated with variation in loading and could be informative about individual joint positioning during locomotion. In this study, we analyse for the first time trabecular bone patterns throughout the femoral head using a whole-epiphysis approach to investigate how potential trabecular variation in humans and great apes relates to differences in locomotor modes. Trabecular architecture was analysed using microCT scans of Pan troglodytes (n = 20), Gorilla gorilla (n = 14), Pongo sp. (n = 5) and Homo sapiens (n = 12) in medtool 4.1. Our results revealed differences in bone volume fraction (BV/TV) distribution patterns, as well as overall trabecular parameters of the femoral head between great apes and humans. Pan and Gorilla showed two regions of high BV/TV in the femoral head, consistent with hip posture and loading during two discrete locomotor modes: knuckle-walking and climbing. Most Pongo specimens also displayed two regions of high BV/TV, but these regions were less discrete and there was more variability across the sample. In contrast, Homo showed only one main region of high BV/TV in the femoral head and had the lowest BV/TV, as well as the most anisotropic trabeculae. The Homo trabecular structure is consistent with stereotypical loading with a more extended hip compared with great apes, which is characteristic of modern human bipedalism. Our results suggest that holistic evaluations of femoral head trabecular architecture can reveal previously undetected patterns linked to locomotor behaviour in extant apes and can provide further insight into hip joint loading in fossil hominins and other primates.
Keywords: Gorilla; Pan; Pongo; African apes; cancellous bone; functional morphology; hominid.
© 2019 Anatomical Society.
Figures
Similar articles
-
Trabecular architecture of the distal femur in extant hominids.J Anat. 2024 Jul;245(1):156-180. doi: 10.1111/joa.14026. Epub 2024 Feb 21. J Anat. 2024. PMID: 38381116 Free PMC article.
-
Metacarpal trabecular bone varies with distinct hand-positions used in hominid locomotion.J Anat. 2019 Jul;235(1):45-66. doi: 10.1111/joa.12966. Epub 2019 May 17. J Anat. 2019. PMID: 31099419 Free PMC article.
-
Trabecular Bone Structure in the Distal Femur of Humans, Apes, and Baboons.Anat Rec (Hoboken). 2020 Jan;303(1):129-149. doi: 10.1002/ar.24050. Epub 2018 Dec 27. Anat Rec (Hoboken). 2020. PMID: 30548834
-
Soft-tissue anatomy of the extant hominoids: a review and phylogenetic analysis.J Anat. 2002 Jan;200(Pt 1):3-49. doi: 10.1046/j.0021-8782.2001.00001.x. J Anat. 2002. PMID: 11833653 Free PMC article. Review.
-
An overview of nutritional factors in the aetiopathogenesis of myocardial fibrosis in great apes.Nutr Res Rev. 2025 Jun;38(1):37-52. doi: 10.1017/S0954422424000076. Epub 2024 Feb 12. Nutr Res Rev. 2025. PMID: 38343129 Review.
Cited by
-
Locomotory behaviour of early tetrapods from Blue Beach, Nova Scotia, revealed by novel microanatomical analysis.R Soc Open Sci. 2021 May 26;8(5):210281. doi: 10.1098/rsos.210281. R Soc Open Sci. 2021. PMID: 34084552 Free PMC article.
-
Trabecular architecture of the distal femur in extant hominids.J Anat. 2024 Jul;245(1):156-180. doi: 10.1111/joa.14026. Epub 2024 Feb 21. J Anat. 2024. PMID: 38381116 Free PMC article.
-
A computational framework for canonical holistic morphometric analysis of trabecular bone.Sci Rep. 2022 Mar 25;12(1):5187. doi: 10.1038/s41598-022-09063-6. Sci Rep. 2022. PMID: 35338187 Free PMC article.
-
Trabecular Architecture of the Proximal Tibia in Extant Hominids.Am J Biol Anthropol. 2025 Jul;187(3):e70084. doi: 10.1002/ajpa.70084. Am J Biol Anthropol. 2025. PMID: 40583737 Free PMC article.
-
Novel strategies for the characterization of cancellous bone morphology: Virtual isolation and analysis.Am J Phys Anthropol. 2021 Aug;175(4):920-930. doi: 10.1002/ajpa.24272. Epub 2021 Apr 3. Am J Phys Anthropol. 2021. PMID: 33811768 Free PMC article.
References
-
- Abbass SJ, Abdulrahman G (2014) Kinematic analysis of human gait cycle. Nahrain Univ Coll Eng J 16, 208–222.
-
- Ahrens J, Geveci B, Law C (2005) ParaView: an end‐user tool for large data visualization In: Visualization Handbook. (eds Hansen CD, Johnson CR.), pp. 717–731. Burlington: Butterworth‐Heinemann.
-
- Aiello L, Dean C (2002) An Introduction to Human Evolutionary Anatomy. San Diego: Academic Press.
-
- Barak MM, Lieberman DE, Hublin J (2011) A Wolff in sheep's clothing: trabecular bone adaptation in response to changes in joint loading orientation. Bone 49, 1141–1151. - PubMed
Publication types
MeSH terms
LinkOut - more resources
Full Text Sources
Research Materials
Miscellaneous
