. 2019 Sep;29(5):658-674.
doi: 10.1111/bpa.12716. Epub 2019 Mar 22.

CDKL5 deficiency predisposes neurons to cell death through the deregulation of SMAD3 signaling

Affiliations

CDKL5 deficiency predisposes neurons to cell death through the deregulation of SMAD3 signaling

Claudia Fuchs et al. Brain Pathol. 2019 Sep.

Erratum in

  • Corrigendum.
    [No authors listed] [No authors listed] Brain Pathol. 2020 May;30(3):721. doi: 10.1111/bpa.12827. Epub 2020 Feb 14. Brain Pathol. 2020. PMID: 32385961 Free PMC article. No abstract available.

Abstract

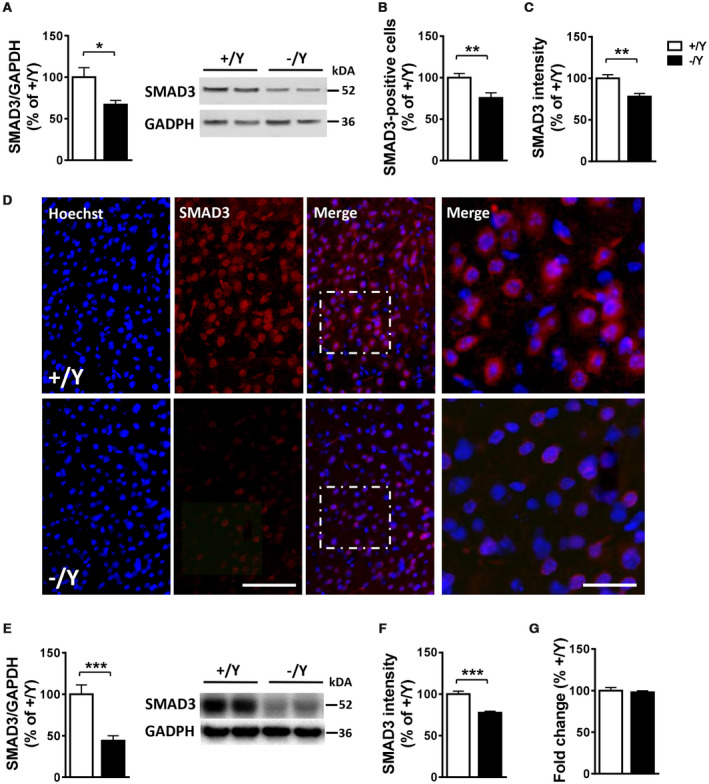
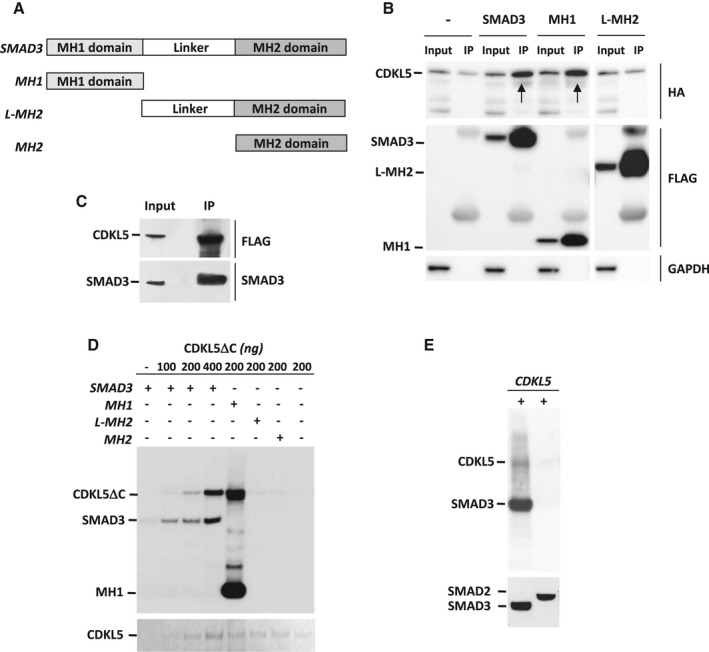
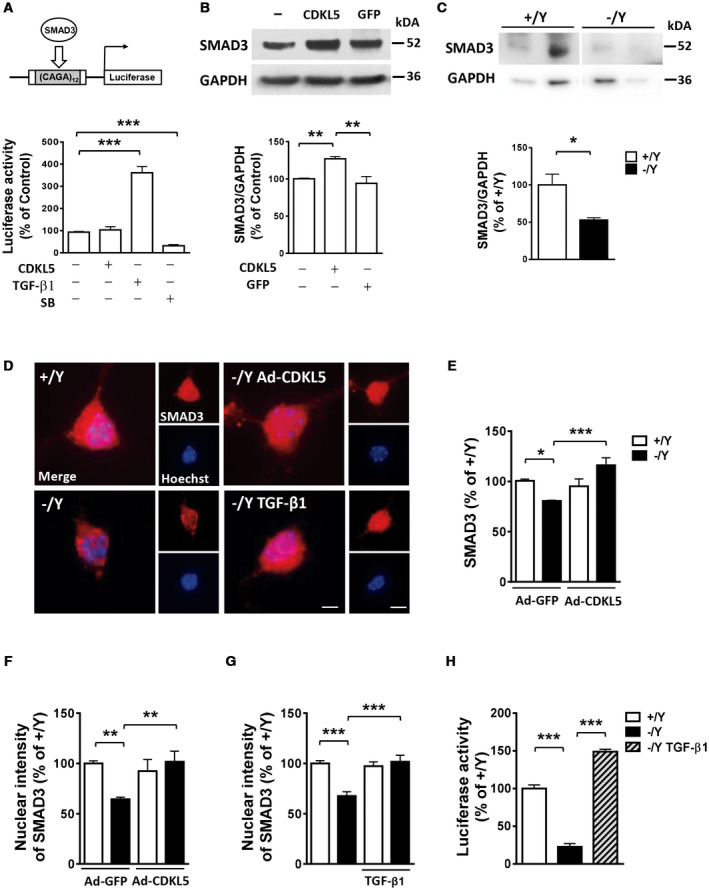
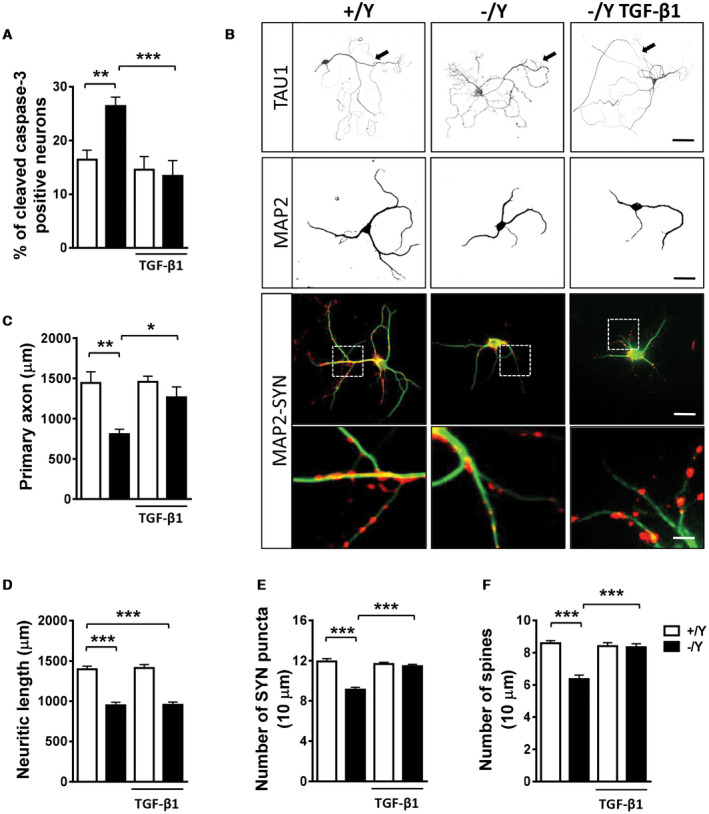
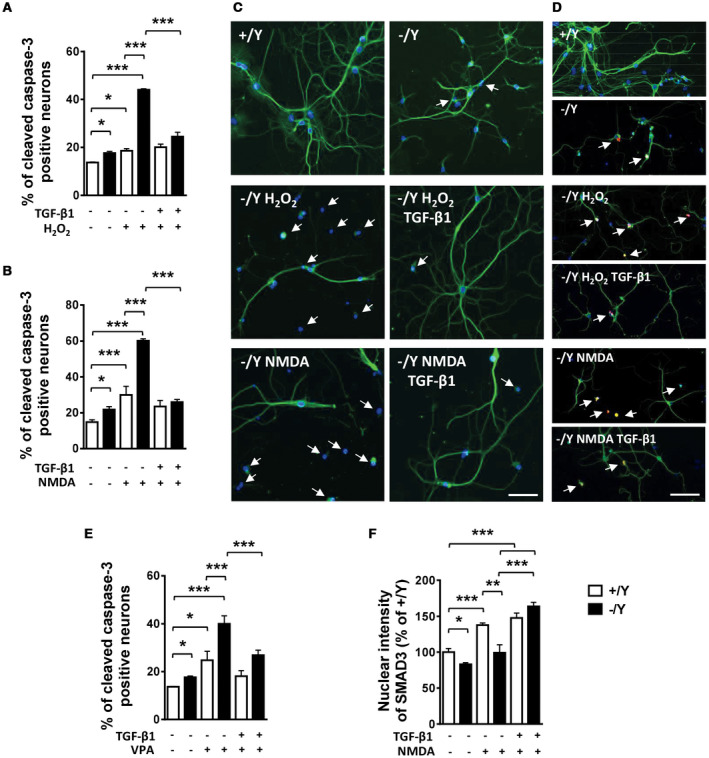
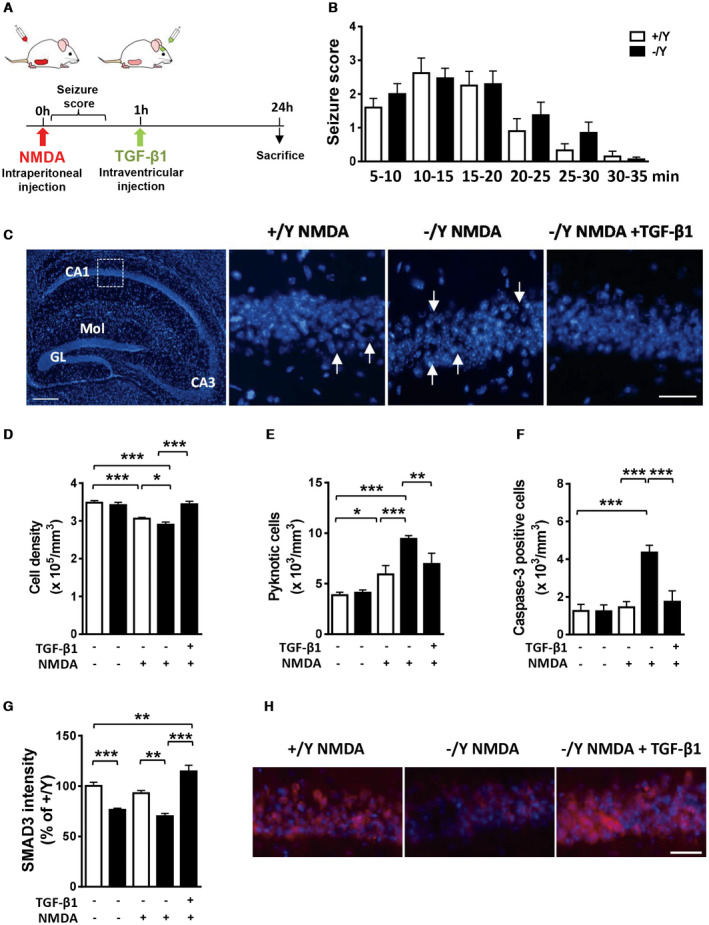
CDKL5 deficiency disorder (CDD) is a rare encephalopathy characterized by early onset epilepsy and severe intellectual disability. CDD is caused by mutations in the X-linked cyclin-dependent kinase-like 5 (CDKL5) gene, a member of a highly conserved family of serine-threonine kinases. Only a few physiological substrates of CDKL5 are currently known, which hampers the discovery of therapeutic strategies for CDD. Here, we show that SMAD3, a primary mediator of TGF-β action, is a direct phosphorylation target of CDKL5 and that CDKL5-dependent phosphorylation promotes SMAD3 protein stability. Importantly, we found that restoration of the SMAD3 signaling through TGF-β1 treatment normalized defective neuronal survival and maturation in Cdkl5 knockout (KO) neurons. Moreover, we demonstrate that Cdkl5 KO neurons are more vulnerable to neurotoxic/excitotoxic stimuli. In vivo treatment with TGF-β1 prevents increased NMDA-induced cell death in hippocampal neurons from Cdkl5 KO mice, suggesting an involvement of the SMAD3 signaling deregulation in the neuronal susceptibility to excitotoxic injury of Cdkl5 KO mice. Our finding reveals a new function for CDKL5 in maintaining neuronal survival that could have important implications for susceptibility to neurodegeneration in patients with CDD.

Keywords: CDKL5; SMAD3; TGF-β signaling; hippocampal neurons; neuronal maturation; neuronal survival.


Conflict of interest statement

All authors reported that they had no biomedical financial interests or potential conflicts of interest.

Figures

Figure 1
Figure 1
Reduced SMAD3 levels in the cortex and hippocampus of Cdkl5 KO mice. A. Western blot analysis of SMAD3 levels normalized to GAPDH levels in the somatosensory cortex of wild‐type (+/Y; n = 3) and Cdkl5 −/Y (n = 4) adult mice. Immunoblots are examples from two animals of each experimental group. B, C. Number of SMAD3 positive cells (B) and SMAD3 nuclear signal intensity (C) in the somatosensory cortex of wild‐type (+/Y; n = 10, n = 4, respectively) and Cdkl5 −/Y (n = 7, n = 4, respectively) adult mice. D. Representative images of cortical sections processed for fluorescent SMAD3 immunostaining of wild‐type (+/Y) and Cdkl5 −/Y mice. The dotted boxes indicate the regions shown at a higher magnification. Scale bar = 50 μm lower magnification, 15 μm higher magnification. E. Western blot analysis of SMAD3 levels normalized to GAPDH levels in the hippocampus of wild‐type (+/Y; n = 7) and Cdkl5 −/Y (n = 8) adult mice. Immunoblots are examples from two animals of each experimental group. F. SMAD3 nuclear signal intensity in the hippocampus of wild‐type (+/Y; n = 8) and Cdkl5 −/Y (n = 8) mice. G. Quantification by RT‐qPCR of SMAD3 expression in the hippocampus of wild‐type (+/Y; n = 8) and Cdkl5 −/Y (n = 8) mice. Data are expressed as a percentage of the values of Cdkl5 +/Y mice. Values are represented as means ± SE. *P < 0.05; **P < 0.01; ***P < 0.001 (Unpaired t‐test).
Figure 2
Figure 2
CDKL5 interacts with, and phosphorylates, SMAD3 protein. A. Schematic representation of SMAD3 and mutant SMAD3 domains. The locations of MH1 domain (light gray), linker region, and MH2 domain (dark gray) are shown. B. Interaction between CDKL5 and SMAD3. HEK293T cells were co‐transfected with HA‐CDKL5 and wild‐type SMAD3‐FLAG or the indicated SMAD3 mutant‐FLAG plasmids, and cell lysates (Input) were immunoprecipitated with anti‐FLAG antibodies (IP). GAPDH was used as an internal control for Input. Immunoprecipitated proteins were detected by anti‐HA (CDKL5) and anti‐FLAG antibodies (SMAD3 and SMAD3 mutants). Arrows indicate co‐immunoprecipitated CDKL5. Lysates of cells overexpressing only HA‐CDKL5 (Input; lane 1) were immunoprecipitated with anti‐FLAG antibodies as a control (IP; lane 2). Irrelevant lanes were spliced out with a white space. C. SH‐SY5Y cells, infected with CDKL5‐FLAG adenoviral particles or GFP adenoviral particles as control, were lysed (Input) and immunoprecipitated with anti‐FLAG antibodies (IP). Immunoprecipitated CDKL5, SMAD3 and GFP were detected by anti‐CDKL5, anti‐SMAD3 and anti‐GFP antibodies, respectively. D. CDKL5 phosphorylates SMAD3 at the MH1 domain. Kinase assays were conducted with purified CDKL5DC (1‐498aa) and SMAD3 or SMAD3 mutants. Samples were resolved by SDS‐PAGE, transferred onto nitrocellulose membrane and exposed to film by autoradiography. CDKL5DC was detected with PonceauS staining (lower panel). E. Immunoprecipitated FLAG‐tagged wild‐type CDKL5 was subjected to an in vitro kinase assay to test its ability to phosphorylate purified SMAD3 and SMAD2. Samples were resolved by SDS‐PAGE, transferred onto nitrocellulose membrane and exposed to film by autoradiography. The same membrane was subjected to immunoblot analyses using anti‐ SMAD3 and SMAD2 antibodies. [Corrections added on 10 February 2020, after first online publication: Figure 2 and the legend have been corrected in this version.]
Figure 3
Figure 3
CDKL5 phosphorylation regulates SMAD3 protein levels. A. Luciferase reporter analysis of SMAD3‐dependent promoter (CAGA12‐luc reporter; schematic representation in the upper panel) in SH‐SY5Y cells transfected with CDKL5 or treated with TGF‐β1 (5 ng/ml) or SB431542 (SB; 10 µM). B. Western blot analysis of SMAD3 levels normalized to GAPDH levels in SH‐SY5Y cells infected with CDKL5 adenoviral particles (Ad‐CDKL5; n = 3), with GFP adenoviral particles (Ad‐GFP; n = 3), or not infected (n = 3). Immunoblots (upper panel) are examples from each experimental group. C. Western blot analysis of SMAD3 levels in 10‐day (DIV10) differentiated hippocampal neurons from wild‐type (+/Y, n = 5) and Cdkl5 −/Y (n = 6) mice. Immunoblots (upper panel) are two examples from each experimental group. D. Representative fluorescent images of 10‐day (DIV10) differentiated hippocampal neurons from wild‐type (+/Y) and Cdkl5 −/Y mice immunopositive for SMAD3 and counterstained with Hoechst. SMAD3 localizes both in the nucleus and in the cytoplasm. Cdkl5 −/Y hippocampal cultures were infected with adenoviral particle for CDKL5 (Ad‐CDKL5) or GFP as a control (Ad‐GFP) on DIV3, or treated with TGF‐β1 (1 ng/ml) administered on alternate days starting from DIV2. Scale bar = 1.5 µm higher magnification, 6 μm lower magnification. E. Quantification of SMAD3 signal intensity in hippocampal neurons infected with adenoviral particle for GFP (Ad‐GFP; +/Y n = 5, −/Y n = 4) or CDKL5 (Ad‐CDKL5; +/Y n = 5, −/Y n = 4). F, G. Quantification of SMAD3 nuclear signal intensity in hippocampal neurons infected with adenoviral particles for GFP (Ad‐GFP ; +/Y n = 5, −/Y n = 4) or CDKL5 (Ad‐CDKL5; +/Y n = 5, −/Y n = 4) in F and untreated (+/Y n = 5, −/Y n = 5) or treated with TGF‐β1 (+/Y n = 4, −/Y n = 5) in G. H. Luciferase reporter analysis of SMAD3‐dependent promoter in primary hippocampal neurons from wild‐type (+/Y, n = 5) and Cdkl5 −/Y (n = 5) mice and in Cdkl5 −/Y cultures treated with TGF‐β1 (5 ng/ml; n = 5). Data are expressed as a percentage of the values of control samples. Values are represented as means ± SE. *< 0.05; **P < 0.01; ***P < 0.001 (Unpaired t‐test in B, C; Fisher’s LSD after ANOVA in A, E–H).
Figure 4
Figure 4
Effect of treatment with TGF‐β1 on survival and maturation of hippocampal neurons from Cdkl5 KO mice. A. Percentage of cleaved caspase‐3 positive neurons in 4‐day differentiated (DIV4) hippocampal neurons from wild‐type (+/Y n = 5) and Cdkl5 −/Y (n = 5) mice. Hippocampal cultures were treated with TGF‐β1 (1 ng/ml) on day 2 postplating (DIV2). B. Representative images of 10‐day (DIV10) differentiated +/Y and −/Y hippocampal neurons and −/Y hippocampal neurons treated with TGF‐β1 (1 ng/ml), administered on alternate days starting from DIV2, immunopositive for the axon marker TAU1 (upper panel; scale bar = 50 µm, arrows indicate the primary axon), microtubule‐associated protein 2 (MAP2; scale bar = 30 µm), or MAP2 (green) plus synaptophysin (SYN, red). The dotted boxes indicate the regions shown at a higher magnification. Scale bar = 30 μm lower magnification, 2.5 μm higher magnification. C–F. Quantification of the length of the primary axon (C, TAU1‐positive; +/Y = 4, −/Y = 4), the total length of MAP2‐positive neurites (D, +/Y = 6, −/Y = 6), the number of SYN‐immunoreactive puncta per 10 μm in proximal dendrites (E, +/Y = 6, −/Y = 6), and the number of MAP2‐positive spines (F, +/Y = 6, −/Y = 6) from differentiated hippocampal cultures from Cdkl5 +/Y and Cdkl5 −/Y mice treated as in (B). Values are represented as means ± SE. *P < 0.05; **P < 0.01; ***P < 0.001 (Fisher’s LSD after ANOVA).
Figure 5
Figure 5
TGF‐β1 treatment rescues the increased susceptibility to neurotoxic stress of hippocampal neurons from Cdkl5 KO mice. A, B. Percentage of cleaved caspase‐3 positive neurons in primary hippocampal neurons from wild‐type and Cdkl5 −/Y mice. Hippocampal cultures were treated on DIV10 with H2O2 (100 μM; +/Y n = 4, −/Y n = 4) or H2O2 + TGF‐β1 (1 ng/ml; +/Y n = 4, −/Y n = 4) in A, and NMDA (100 μM; +/Y n = 4, −/Y n = 4) or NMDA + TGF‐β1 (1 ng/ml; +/Y n = 3, −/Y n = 4) in B, and fixed after 24 h. C. Representative fluorescent images of differentiated hippocampal neurons from wild‐type (+/Y) and Cdkl5 −/Y mice immunopositive for MAP2 (green) and stained with Hoechst (blue). Cultures were treated as in (A, B). White arrows indicate pyknotic nuclei. Scale bar = 30 μm. D. Representative fluorescent images of differentiated hippocampal neurons from wild‐type (+/Y) and Cdkl5 −/Y mice immunopositive for MAP2 (green) and cleaved caspase 3 (red), and stained with Hoechst (blue). Cultures were treated as in (A, B). White arrows indicate apoptotic cells positive for cleaved caspase 3. Scale bar = 40 μm. E. Percentage of cleaved caspase‐3 positive neurons over total neuron number from wild‐type and Cdkl5 −/Y mice. Hippocampal cultures were treated with VPA (1 mM; +/Y n = 4, −/Y n = 4) or VPA + TGF‐β1 (1 ng/ml; +/Y n = 4, −/Y n = 4). F. Quantification of SMAD3 signal intensity in untreated (+/Y n = 3, −/Y n = 3), NMDA‐treated (+/Y n = 4, −/Y n = 3), and NMDA + TGF‐β1‐treated (+/Y n = 3, −/Y n = 3) hippocampal neurons immunostained for SMAD3. Data in E are expressed as a percentage of the values of untreated +/Y. Values are represented as means ± SE. *P < 0.05; **P < 0.01; ***P < 0.001 (Fisher’s LSD after ANOVA).
Figure 6
Figure 6
Effect of treatment with TGF‐β1 on NMDA‐induced hippocampal neuron cell death in Cdkl5 KO mice. A. Schematic view of in vivo treatments and analysis schedule. B. Graph represents NMDA‐induced seizure score for wild‐type (+/Y, n = 13) and Cdkl5 −/Y (n = 17) mice at indicated time points after NMDA injection. C: Left panel: representative fluorescence image of a hippocampal section processed for Hoechst staining. Abbreviations: GL, granule cell layer; Mol, molecular layer. Scale bar = 150 μM. The dotted box in the panel indicates the analyzed region (CA1). Magnifications in the right‐hand side panels show examples of the pyramidal neuron layer in CA1 of a Cdkl5 +/Y and a Cdkl5 −/Y mouse treated with NMDA (60 mg/kg), and of a Cdkl5 −/Y mouse treated with NMDA and TGF‐β1 (50 ng). Arrows indicate the neuronal damage sites. Scale bar = 100 μM. D–F. Quantification of Hoechst‐positive cells (D), number of pyknotic nuclei (E), and number of cleaved caspase‐3 positive cells (F) in CA1 of hippocampal sections from untreated (+/Y n = 5, −/Y n = 5), NMDA‐treated (+/Y n = 8, −/Y n = 9), and NMDA + TGF‐β1 treated (−/Y n = 5) mice. G: Quantification of SMAD3 signal intensity in the CA1 pyramidal neuron layer of Cdkl5 +/Y and Cdkl5 −/Y mice treated as in D. H. Representative fluorescent images of the pyramidal neuron layer in CA1 of a Cdkl5 +/Y and a Cdkl5 −/Y mouse treated with NMDA (60 mg/kg), and of a Cdkl5 −/Y mouse treated with NMDA and TGF‐β1 (50 ng) immunostained for SMAD3 and counterstained with Hoechst. Scale bar = 50 μM. Values are represented as means ± SE. *P < 0.05; **P < 0.01; ***P < 0.001 (Fisher’s LSD after ANOVA).

Similar articles

Cited by

References

    1. Amendola E, Zhan Y, Mattucci C, Castroflorio E, Calcagno E, Fuchs C et al (2014) Mapping pathological phenotypes in a mouse model of CDKL5 disorder. PloS one 9:e91613. - PMC - PubMed
    1. Bahi‐Buisson N, Bienvenu T (2012) CDKL5‐related disorders: from clinical description to molecular genetics. Mol Syndromol 2:137–152. - PMC - PubMed
    1. Baltussen LL, Negraes PD, Silvestre M, Claxton S, Moeskops M, Christodoulou E et al (2018) Chemical genetic identification of CDKL5 substrates reveals its role in neuronal microtubule dynamics. EMBO J 37:e99763. - PMC - PubMed
    1. Barbiero I, Peroni D, Tramarin M, Chandola C, Rusconi L, Landsberger N, Kilstrup‐Nielsen C (2017) The neurosteroid pregnenolone reverts microtubule derangement induced by the loss of a functional CDKL5‐IQGAP1 complex. Hum Mol Gen 26:3520–3530. - PubMed
    1. Bertani I, Rusconi L, Bolognese F, Forlani G, Conca B, De Monte L et al (2006) Functional consequences of mutations in CDKL5, an X‐linked gene involved in infantile spasms and mental retardation. J Biol Chem 281:32048–32056. - PubMed

Publication types

Substances

Supplementary concepts