. 2019 Jun;18(3):e12924.
doi: 10.1111/acel.12924. Epub 2019 Feb 21.

Systems biology identifies preserved integrity but impaired metabolism of mitochondria due to a glycolytic defect in Alzheimer's disease neurons

Affiliations

Systems biology identifies preserved integrity but impaired metabolism of mitochondria due to a glycolytic defect in Alzheimer's disease neurons

Pierre Theurey et al. Aging Cell. 2019 Jun.

Abstract

Mitochondrial dysfunction is implicated in most neurodegenerative diseases, including Alzheimer's disease (AD). We here combined experimental and computational approaches to investigate mitochondrial health and bioenergetic function in neurons from a double transgenic animal model of AD (PS2APP/B6.152H). Experiments in primary cortical neurons demonstrated that AD neurons had reduced mitochondrial respiratory capacity. Interestingly, the computational model predicted that this mitochondrial bioenergetic phenotype could not be explained by any defect in the mitochondrial respiratory chain (RC), but could be closely resembled by a simulated impairment in the mitochondrial NADH flux. Further computational analysis predicted that such an impairment would reduce levels of mitochondrial NADH, both in the resting state and following pharmacological manipulation of the RC. To validate these predictions, we utilized fluorescence lifetime imaging microscopy (FLIM) and autofluorescence imaging and confirmed that transgenic AD neurons had reduced mitochondrial NAD(P)H levels at rest, and impaired power of mitochondrial NAD(P)H production. Of note, FLIM measurements also highlighted reduced cytosolic NAD(P)H in these cells, and extracellular acidification experiments showed an impaired glycolytic flux. The impaired glycolytic flux was identified to be responsible for the observed mitochondrial hypometabolism, since bypassing glycolysis with pyruvate restored mitochondrial health. This study highlights the benefits of a systems biology approach when investigating complex, nonintuitive molecular processes such as mitochondrial bioenergetics, and indicates that primary cortical neurons from a transgenic AD model have reduced glycolytic flux, leading to reduced cytosolic and mitochondrial NAD(P)H and reduced mitochondrial respiratory capacity.

Keywords: Alzheimer's disease; glycolysis; mitochondria; neurons; systems biology.


Conflict of interest statement

None declared.

Figures
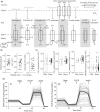
Figure 1
Figure 1
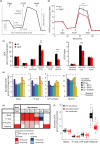
Parameterization and calibration of ordinary differential equation flux‐based model to experiments in primary cortical neurons from wild‐type (WT) mice. (a) Schematic indicating model compartments, modules and fluxes. Drug additions were simulated by altering the fluxes through the indicated modules. IMM, inner mitochondrial membrane; OMM, outer mitochondrial membrane; IMS, intermembrane space. (b) Simulated values (30 simulations, black dots) for mitochondrial pH, mitochondrial membrane potential (Δψm) and cytosolic ATP concentration, compared to the range of values reported in the literature (black lines). (c) The simulated response (Sims; mV or fold change (FC) over baseline) of the mitochondrial membrane potential (ΔΨm) to oligomycin (Oligo), rotenone (Rot) and antimycin A (AntiA) closely resembled TMRM and NAD(P)H autofluorescence measurements in WT primary cortical neurons (CNs; values compared 20 min after drug addition). Rotenone/antimycin A were simulated by reducing complex I/III activity respectively to 20% of unperturbed condition, oligomycin by reducing F1Fo ATP synthase activity to 13%, and FCCP by increasing H+ leak flux activity to 11*baseline flux. (d) The simulated flux through complex IV (Di), used as a proxy for the mitochondrial oxygen consumption rate, closely resembled oxygen consumption rate measurements in populations of WT primary cortical neurons (Dii) exposed to Oligo (2 μg/ml), FCCP (0.5 μM) and AntiA (1 μM). Traces represent individual simulations or wells. The mean of all traces is shown in black. Nonmitochondrial respiration has been subtracted from the experimental traces
Figure 2
Figure 2
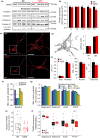
Oxygraphy measurements in live cells show impairment of maximal respiration in transgenic AD neurons, and the computational model predicts that this can be explained by a defect in mitochondrial NADH flux. (a) The experimental protocol followed to measure the oxygen consumption rate (OCR) in primary cortical neurons. The classical “mitochondrial stress test” assesses mitochondrial respiratory activity: oligomycin (Oligo, 2 μg/ml) inhibits the F1Fo ATP synthase, FCCP (0.5 μM) uncouples respiration, and antimycin A (AntiA; 1 μM) inhibits electron flow and abolishes mitochondrial respiration. Nonmitochondrial OCR (OCR remaining after addition of all drugs) is subtracted from all measurements to calculate the displayed OCR metrics (Brand & Nicholls, 2011): basal = mitochondria‐specific respiration at rest; ATP synthesis = basal OCR dedicated to ATP production (oligomycin‐sensitive respiration); proton (H+) leak = basal OCR uncoupled from ATP production (oligomycin‐insensitive respiration); maximal OCR = OCR upon uncoupling of respiration from ATP production; spare capacity = “spare” OCR available while at rest (maximal–basal). (b) Mean OCR measured in primary cortical neurons from wild‐type (WT) and transgenic AD (TgAD) mice. *p = 0.006. n (independent cultures‐number of wells): WT 7‐37, TgAD 8‐43. (c) OCR metrics calculated from measurements in WT and TgAD cortical neurons, as in (a). Coupling efficiency (= ATP synthesis/basal) reports the relative fluxes through the ATP synthase and proton leak pathways. Cell RCR max. and cell RCR basal (= maximal/H+ leak and basal/H+ leak, respectively) report the efficiency of substrate oxidation in the basal or maximal respiration state. **p < 0.01; ***p < 0.001. n: WT 10‐67, TgAD 12‐75. (d) Mean OCR metrics predicted by the computational model with no simulated impairment (WTsim), and impairments simulated in the indicated fluxes (100 simulations for each). Impairments were simulated by reducing fluxes to 70% of WTsim for respiratory complex I (CI), CIII, CIV and F1Fo ATP synthase; increasing the H+ leak flux (Hle) to 150% of WTsim; or reducing the NADH flux to 95% WTsim. The dashed lines indicate the statistical thresholds defined to identify whether predicted changes were likely to be measured experimentally (see Section 4). H+ leak and ATP synthesis are reported as oligomycin‐insensitive and oligomycin‐sensitive respiration, respectively, to allow direct comparison with experiments (see Supporting Information Appendix S1). (e) Heatmap highlighting the OCR metrics that differ between WT and TgAD neurons. The first column illustrates that only maximal respiration differed between WT and TgAD neurons in experimental measurements (shaded dark red). The subsequent columns indicate the changes predicted by the computational model with impairments simulated as in (d). Changes > ±10% compared to WTsim are marked light blue/red, while changes that exceed the statistically defined thresholds are marked dark blue/red. The model predicted that only an impairment in NADH flux could correctly reproduce the experimentally observed behaviour. (f) Predicted OCR metrics in WTsim compared to simulations with impaired NADH flux. The mean value is plotted as an unfilled circle within the boxplots (100 simulations)
Figure 3
Figure 3
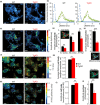
Primary cortical neurons from transgenic AD mice have preserved respiratory chain protein expression, mitochondrial morphology and network dynamics, while the mitochondrial membrane potential following uncoupling is significantly reduced. (a) Representative Western blots with molecular weight markings to the right of the blots, and (b) corresponding densitometry analysis of the expression level of subunits of the respiratory chain complexes (I‐IV) and the F1Fo ATP synthase, from WT and transgenic AD (TgAD) primary cortical neurons. The heat‐shock protein 90 (HSP90) was used as a loading control. n (independent cultures): WT 5 and TgAD 7. Black vertical lines indicate where some blots were cut to remove the molecular weight marker. (c) Representative confocal images of primary cortical neurons (after 6 DIV) transfected with a mitochondrial red fluorescent protein (mtDsRed) highlight the intricate mitochondrial network throughout the neuron. Scale bar, 10 μm. (d) Morphological characterization of the mitochondrial network after segmentation includes analysis of form factor (FF) and aspect ratio (AR), two geometric indicators of mitochondrial shape in terms of elongation and branching; and (e) measurements of the size (area and perimeter) and number of individual mitochondria, and the total mitochondrial area within individual neurons. n (independent cultures‐number of neurons): WT 3‐15, TgAD 3‐15; with an average of 80–100 mitochondria analysed per neuron. (f, g) Predicted mitochondrial membrane potential (f) at baseline (dashed lines indicate the statistical thresholds defined to identify whether predicted changes were likely to be measured experimentally [see Section 4]), and (g) fold change following addition of oligomycin (Oligo), rotenone, antimycin A (AntiA) or FCCP. Predictions were analysed with no simulated impairment (WTsim) and with impairments simulated in the indicated fluxes (100 simulations for each). Impairments were simulated by reducing fluxes to 70% of WTsim for respiratory complex I (CI), CIII, CIV and F1Fo ATP synthase; increasing the H+ leak flux (Hle) to 150% of WTsim; or reducing the NADH flux to 95% WTsim. (h) A significant difference in baseline TMRM fluorescence was not detected between WT and TgAD neurons (measured following addition of K+ gluconate to dissipate the plasma membrane potential). n: WT 4‐32, TgAD 2‐31. (i) No differences in TMRM fluorescence fold changes were measured between WT and TgAD neurons in response to F1Fo ATP synthase inhibition with oligomycin (2 μg/ml; n: WT 3‐21, TgAD 3‐16), complex I inhibition with rotenone (2 μM; n: WT 4‐17, TgAD 3‐16), nor complex III inhibition with antimycin A (AntiA 1 μM; n: WT 4‐20, TgAD 3‐21). In contrast, mitochondrial uncoupling with FCCP induced a significantly larger drop in TMRM fluorescence in TgAD neurons (n: WT 3‐44, TgAD 2‐18)
Figure 4
Figure 4
NAD(P)H autofluorescence measurements confirm the computationally predicted defect in mitochondrial NADH production in transgenic AD neurons. (a) Predicted mitochondrial NADH levels at baseline and following addition of rotenone (Rot), oligomycin (Oligo), FCCP and FCCP + rotenone (FCCP+Rot). NADH levels here represent redox status (NADH/NAD+), as we simulate a constant NADH size. Predictions were analysed as in Figure 3. (b) Representative NAD(P)H autofluorescence and brightfield images in WT primary cortical neurons. Scale bars, 10 μm. (c–e) Time‐series autofluorescence measurements (mean ± SEM) from the cell bodies of single neurons in WT and transgenic AD (TgAD) primary cortical neurons, normalized to the baseline signal. The times of drug additions are indicated with arrows. (c) No differences were seen between WT and TgAD neurons following induction of maximal NAD(P)H autofluorescence with oligomycin (Oligo; 2 μg/ml). Oligomycin indirectly inhibits NAD(P)H consumption by reducing respiratory chain activity. n (independent cultures‐number of neurons): WT 5‐37, TgAD 5‐38. (d) Similarly, NAD(P)H autofluorescence levels after rotenone (Rot; 2 μM) did not differ between WT and TgAD neurons. Rotenone directly blocks NAD(P)H consumption through its inhibition of complex I. n: WT 5‐38, TgAD 4‐32. (e) Minimal NAD(P)H autofluorescence levels following FCCP addition (0.5 μM) did not differ between genotypes, but levels following subsequent rotenone addition (Rot, 2 μM) were significantly lower in TgAD neurons compared to WT (*p < 0.05). n: WT 4‐20, TgAD 5‐27. (f) Average NAD(P)H autofluorescence time‐series traces enlarged from (d) (left) and rate of increase of autofluorescence signal following rotenone addition (right). The rate of increase was significantly slower in TgAD neurons (***p = 6 × 10−5)
Figure 5
Figure 5
NAD(P)H FLIM measurements confirm reduced mitochondrial NAD(P)H in transgenic AD neurons and identify a reduction in cytosolic NAD(P)H. (a) Representative NAD(P)H autofluorescence intensity in primary cortical neurons (WT and TgAD), collected with a 2‐photon microscope under 740 nm excitation. (b) Distribution of photons as a function of their fluorescence lifetimes, illustrating the two NAD(P)H lifetimes—short (~0.5 ns, blue scatter points) and long (~2.8 ns, green scatter points)—corresponding respectively to free and protein‐bound NAD(P)H in WT and TgAD neurons. (c–j) FLIM measurements. The autofluorescence signal amplitude (d, e, j) is proportional to the NAD(P)H concentration at the specific lifetime. Average lifetimes weighted by amplitude (g) and ratio of the amplitudes at the long and short lifetimes (i) represent the proportion of aerobic/glycolytic metabolism of the neuron, in relation to NAD(P)H. **p < 0.01. (c) Representative images and (d) average amplitude of the NAD(P)H autofluorescence normalized by the ROI area in pixels, associated with the short (A1) and long (A2) lifetimes separated and together (A1+A2) detected in the cell body. n (independent cultures‐number of neurons): WT 5‐32, TgAD 4‐33. (e) Average total NAD(P)H amplitude in mitochondria. n: WT 5‐15, TgAD 4‐12. (f) Representative images and (g) average lifetime weighted by amplitude in WT and TgAD neurons in the cell body. (h) Representative images and (i) ratio of the amplitudes at the long and short lifetimes (A1/A2) in the cell body of WT and TgAD neurons. (j) Average amplitude of the NAD(P)H autofluorescence signal in the nucleus (equivalent to cytosol) of WT and TgAD neurons. For panels g, i and j, n: WT 5‐32, TgAD 4‐33. For all images, scale bar, 10 μm
Figure 6
Figure 6
Extracellular acidification rate (ECAR) measurements demonstrate a glycolytic defect in transgenic AD neurons, and experiments in pyruvate suggest a causal relationship between glycolytic and mitochondrial impairments. (a) Experimental protocol followed to measure the extracellular acidification rate (ECAR) in primary cortical neurons. Maximal glycolysis = ECAR after inhibition of F1Fo ATP synthase activity with oligomycin (Oligo; 2 μg/ml). Glycolytic reserve (Glyc. reserve) = “spare” ECAR available while at rest (maximal–basal). (b) Basal ECAR and the oxygen consumption rate (OCR)/ECAR ratio in WT and transgenic AD (TgAD) neurons. TgAD neurons had significantly lower ECAR compared to WT, and were more aerobic (higher OCR/ECAR ratio). *p < 0.05, ***p < 0.001. n (independent cultures‐number of wells): WT 10‐134, TgAD 12‐120. (c) Maximal glycolysis (Max. glyc.) and glycolytic reserve were also significantly lower in TgAD transgenic neurons (**p < 0.01, ***p < 0.001). n: WT 5‐44, TgAD 7‐51. (d) Proportion of glycolytic (black) and oxidative (grey) ATP production in basal conditions. (e) Glycolytic, oxidative and total ATP production in basal conditions and following oligomycin addition (+Oligo; 2 μg/ml), normalized to WT basal levels. (d, e) **p < 0.01; ***p < 0.001. n: WT 10‐73, TgAD 12‐76. (f) Representative Western blots with molecular weight markings to the right of the blots, and (g) corresponding densitometry analysis of proteins involved in glucose metabolism—glucose transporter 3 (GLUT3; n (independent cultures): WT 5, TgAD 7), hexokinase 1 (HK1), lactate dehydrogenase (LDH), mitochondrial pyruvate carriers 1/2 (MPC1/2) (all n: WT 4, TgAD 4). Actin or HSP90 were used as loading controls. Black vertical lines indicate where some blots were cut to remove the molecular weight marker. (h–k) Measurements in WT and TgAD neurons supplemented with 5 mM pyruvate. (h) Basal OCR, proton leak, ATP synthesis and maximal OCR, as described in Figure 2a and measured by Seahorse (n = independent cultures‐number of wells: basal, WT 13‐107, TgAD 14‐110; H+ leak & ATP turnover, WT 7‐49, TgAD 7‐44; maximal, WT 6‐58, TgAD 7‐66). (i) Rate of increase of autofluorescence signal following rotenone (2 μM) addition (n = independent cultures‐number of neurons: WT 5‐35, TgAD 4‐26). (j) NAD(P)H autofluorescence following FCCP (0.5 μM) and rotenone (Rot, 2 μM) addition, as measured using epifluorescence microscopy (n = independent cultures‐number of neurons: WT 4‐25, TgAD 3‐25). (k) Amplitude of the NAD(P)H autofluorescence signal (A1+A2) and average lifetime in the cell body and in mitochondria, as measured by FLIM (n = independent cultures‐number of neurons: cell body, WT 5‐45, TgAD 6‐68; mitochondria, WT 5‐12, TgAD 6‐17)

References

    1. Aguilar‐Arnal, L. , Ranjit, S. , Stringari, C. , Orozco‐Solis, R. , Gratton, E. , & Sassone‐Corsi, P. (2016). Spatial dynamics of SIRT1 and the subnuclear distribution of NADH species. Proceedings of the National Academy of Sciences of the United States of America, 113(45), 12715–12720. 10.1073/pnas.1609227113 - DOI - PMC - PubMed
    1. Ankarcrona, M. , Mangialasche, F. , & Winblad, B. (2010). Rethinking Alzheimer's disease therapy: Are mitochondria the key? Journal of Alzheimer's Disease, 20(Suppl 2), S579–590. 10.3233/JAD-2010-100327 - DOI - PubMed
    1. Baloyannis, S. J. (2006). Mitochondrial alterations in Alzheimer's disease. Journal of Alzheimer's Disease, 9, 119–126. 10.3233/JAD-2006-9204 - DOI - PubMed
    1. Bazil, J. N. , Beard, D. A. , & Vinnakota, K. C. (2016). Catalytic coupling of oxidative phosphorylation, ATP demand, and reactive oxygen species generation. Biophysical Journal, 110, 962–971. 10.1016/j.bpj.2015.09.036 - DOI - PMC - PubMed
    1. Beard, D. A. (2005). A biophysical model of the mitochondrial respiratory system and oxidative phosphorylation. PLoS Computational Biology, 1, e36 10.1371/journal.pcbi.0010036 - DOI - PMC - PubMed

Publication types