. 2019 May;23(5):3386-3401.
doi: 10.1111/jcmm.14235. Epub 2019 Feb 22.

MARCH1 encourages tumour progression of hepatocellular carcinoma via regulation of PI3K-AKT-β-catenin pathways

Affiliations

MARCH1 encourages tumour progression of hepatocellular carcinoma via regulation of PI3K-AKT-β-catenin pathways

Lulu Xie et al. J Cell Mol Med. 2019 May.

Abstract

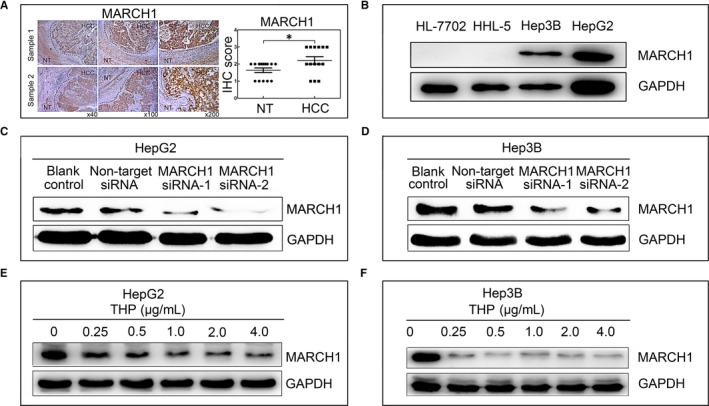
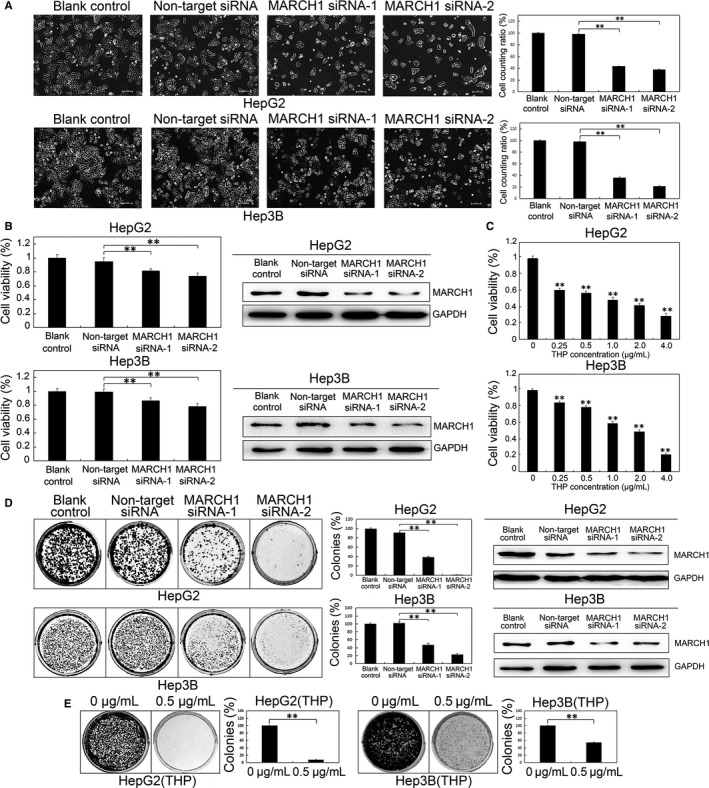
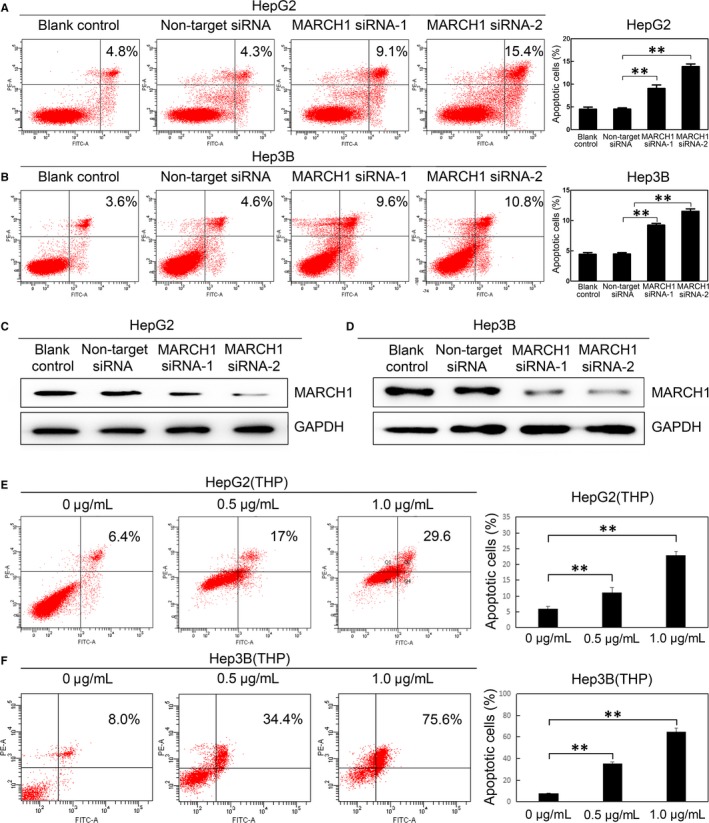
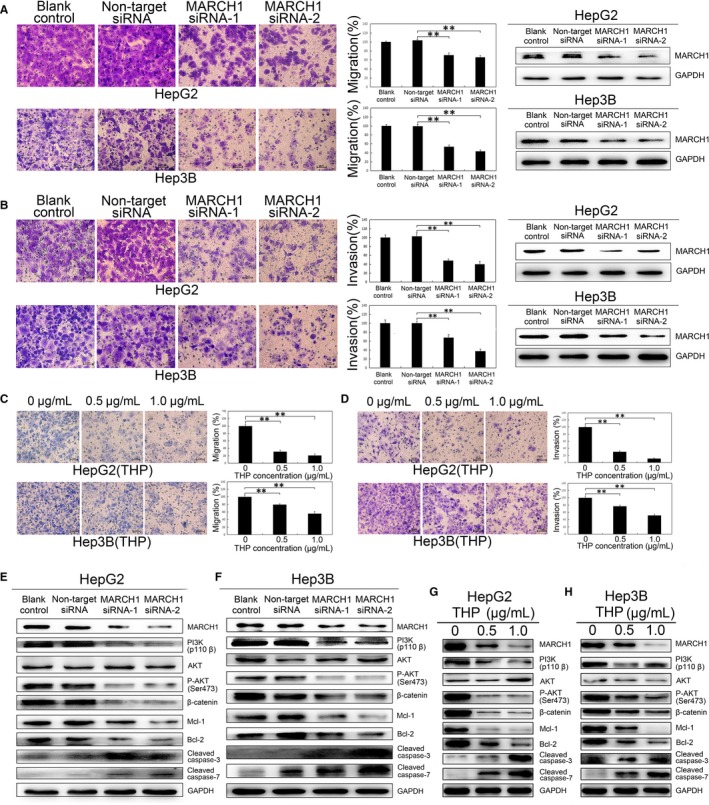
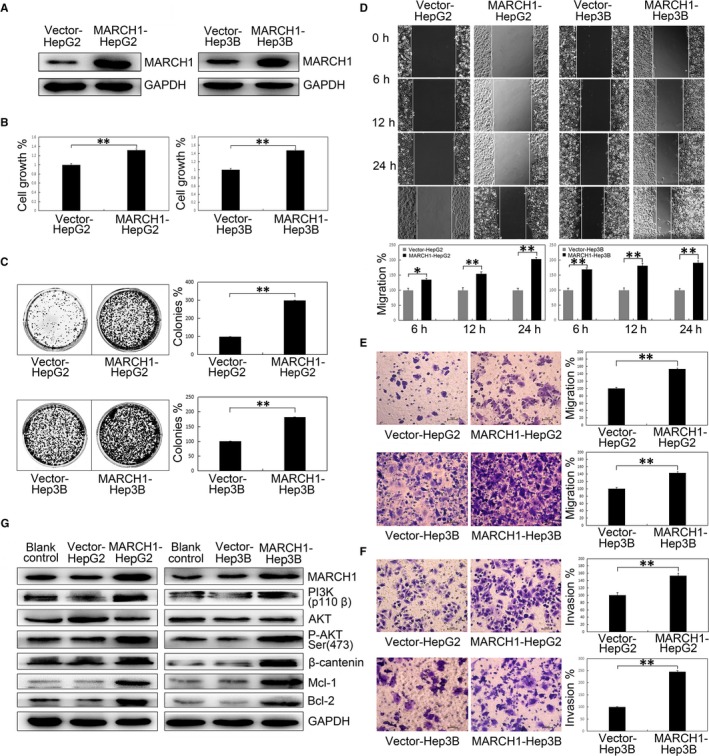
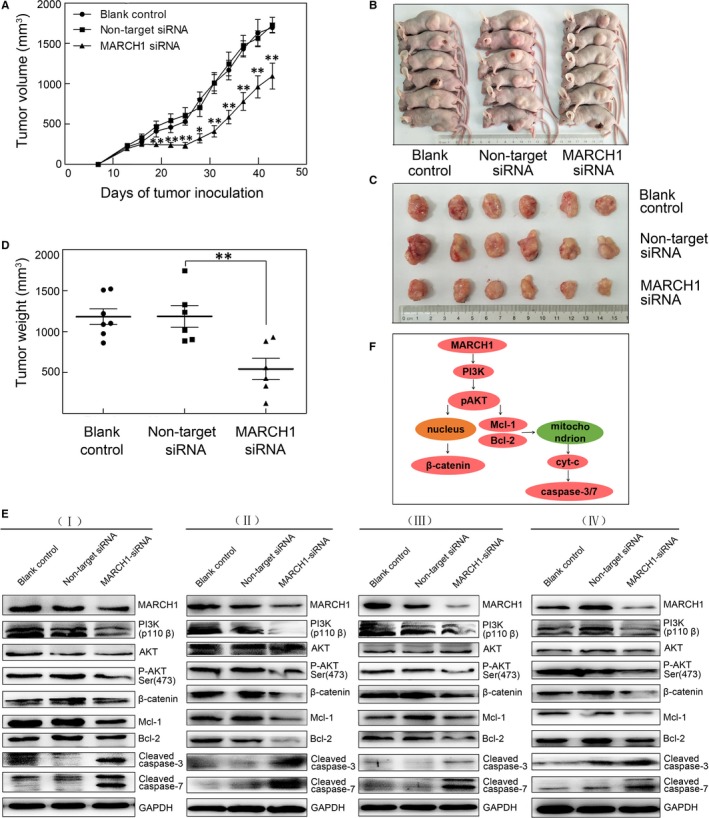
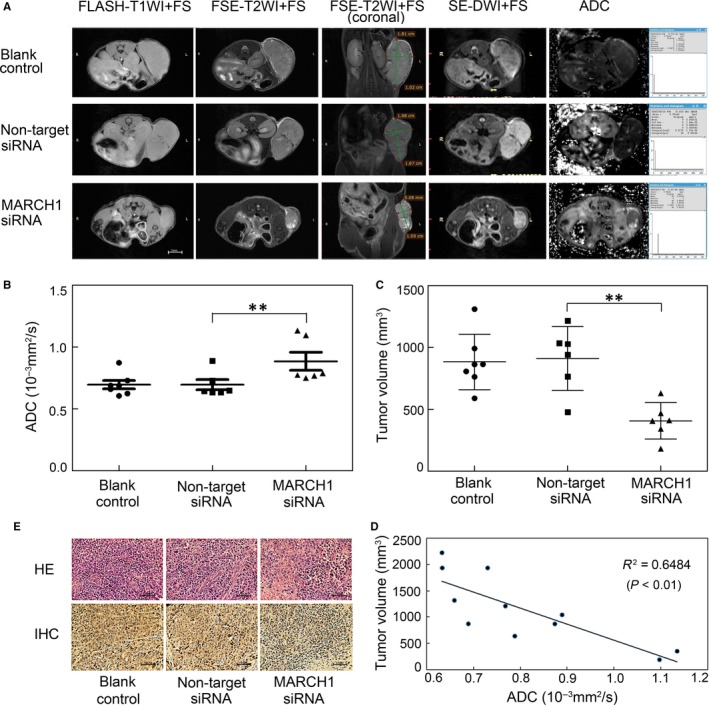
Membrane-associated RING-CH-1 (MARCH1) is a membrane-anchored E3 ubiquitin ligase that is involved in a variety of cellular processes. MARCH1 was aberrantly expressed as a tumour promoter in ovarian cancer, but the signalling about the molecular mechanism has not yet been fully illuminated. Here, we first determined that MARCH1 was obviously highly expressed in human hepatocellular carcinoma samples and cells. In addition, our findings demonstrated that the proliferation, migration and invasion of hepatocellular carcinoma were suppressed, but the apoptosis was increased, as a result of MARCH1 knockdown by either siRNA targeting MARCH1 or pirarubicin treatment. Conversely, the proliferation, migration and invasion of hepatocellular carcinoma were obviously accelerated, and the apoptosis was decreased, by transfecting the MARCH1 plasmid to make MARCH1 overexpressed. Moreover, in vivo, the results exhibited a significant inhibition of the growth of hepatocellular carcinoma in nude mice, which were given an intra-tumour injection of siRNA targeting MARCH1. Furthermore, our study concluded that MARCH1 functions as a tumour promoter, and its role was up-regulated the PI3K-AKT-β-catenin pathways both in vitro and in vivo. In summary, our work determined that MARCH1 has an important role in the development and progression of hepatocellular carcinoma and may be used as a novel potential molecular therapeutic target in the future treatment of hepatocellular carcinoma.

Keywords: Invasion; MARCH1; apoptosis; hepatocellular carcinoma; migration; nude mouse model; pathways; pirarubicin; proliferation.


Conflict of interest statement

The authors declare that they have no competing financial interests.

Figures

Figure 1
Figure 1
MARCH1 was highly expressed in the human hepatocellular carcinoma (HCC) tumour samples and cell lines (Hep3B and HepG2). A, Immunohistochemistry (IHC) analyses showing increased MARCH1 expression in liver tissue from patients with HCC compared with adjacent non‐tumour (NT) liver tissue; and the IHC score of MARCH1 in 14 cases. B, Western blotting assay showing the expression of MARCH1 in the four cell lines. C and D, Western blotting analysis was used to assay the interference efficiency of the two sequences of MARCH1 siRNA in the HepG2 and Hep3B cells for 48 h. E and F, Western blotting assay showed the MARCH1 protein levels in the HepG2 and Hep3B cells treated with pirarubicin (THP) for 24 h and 48 h in different concentrations, respectively. All the data in this figure are represented as mean ± SD. *< 0.05
Figure 2
Figure 2
Down‐regulated MARCH1 inhibited human HCC cell proliferation. A, Representative microscope images of the HepG2 and Hep3B cells of MARCH1 siRNA interference for 48 h. B, The cell viability of the HepG2 and Hep3B cells transfected with MARCH1 siRNA (MARCH1 siRNA‐1 and MARCH1 siRNA‐2) and negative siRNA (non‐target siRNA) at 48 h post‐transfection is presented as a per cent of the cell viability attained by the non‐transfected cells (blank control). Western blotting assay was used to confirm the MARCH1 down‐regulation by siRNA. C, The cell viability of the HepG2 and Hep3B cells treated by THP in different concentrations for 24 h and 48 h, respectively, was assayed using a CCK‐8 cell proliferation assay,0 μg/mL was used as compared groups. D, Colony formation assay of transfected HepG2 and Hep3B cells. 5000 cells were seeded in 6‐well plates and grown for over 12 days. The colonies were stained with crystal violet solution, photographed and counted. The down‐regulation of the MARCH1 protein levels of colonies by siRNA for 6 d was confirmed by Western blot analysis. E, The colony formation assay of the HepG2 and Hep3B cells treated with THP. All the data in this figure are represented as mean ± SD. **< 0.01
Figure 3
Figure 3
Down‐regulated MARCH1 induced human HCC cell apoptosis. A and B, The cell apoptosis ratio of the HepG2 and Hep3B cells transfected with the two sets of MARCH1 siRNA, negative siRNA and non‐transfected for 48 h, respectively. C and D, Western blotting assay was used to confirm the MARCH1 down‐regulation by siRNA. E and F, Cell apoptosis ratio of the HepG2 and Hep3B cells treated with THP in different concentrations for 24 h and 48 h, respectively. All the data in this figure are represented as mean ± SD. ** < 0.01
Figure 4
Figure 4
MARCH1 knockdown inhibited human HCC cell migration and invasion through down‐regulated PI3K/P‐AKT/β‐catenin pathways and induced apoptosis. A and B, In vitro migration and invasion assay for the negative control and MARCH1 siRNA in the HepG2 and Hep3B cells. Knockdown of the MARCH1 protein with siRNAs in the human HepG2 and Hep3B HCC cells. C and D, In vitro migration and invasion assay for the HepG2 and Hep3B cells with THP in concentrations of 0, 0.5 and 1.0 μg/mL. E and F, Protein expression of MARCH1, PI3K, AKT, P‐AKT, β‐catenin, MCL‐1, BCL‐2, Cleaved caspase‐3 and Cleaved caspase‐7 in the HepG2 and Hep3B cells. G and H, And in the HepG2 and Hep3B cells with 0, 0.5 and 1.0 μg/mL THP concentrations. All the data in this figure are represented as mean ± SD. **< 0.01
Figure 5
Figure 5
MARCH1 overexpression accelerated human HCC progression of proliferation, colony formation, wound healing, transwell migration and invasion by activating the PI3K/P‐AKT/β‐catenin pathways. A, Overexpression of the MARCH1 protein with empty vectors and plasmids in the human HepG2 and Hep3B HCC cells. In vitro (B) cell proliferation and (C) colony formation in the HepG2 and Hep3B cells with empty vectors and MARCH1 overexpression. D, In vitro wound healing assay in the HepG2 and Hep3B cells with empty vectors and MARCH1 overexpression. 40 × images show the wound size at 0, 6, 12 and 48 h after the scratch. E and F, In vitro transwell migration and invasion in the HepG2 and Hep3B cells with empty vectors and MARCH1 overexpression. G, Protein expression of MARCH1, PI3K, AKT, P‐AKT, β‐catenin, MCL‐1, BCL‐2 in the human HepG2 and Hep3B cells transfected with empty vectors and plasmids. All the data in this figure are represented as mean ± SD. *P < 0.05, **< 0.01
Figure 6
Figure 6
MARCH1 silencing inhibited tumour growth in nude mice via the down‐regulating of the PI3K/P‐AKT/β‐catenin pathways. A, Tumour growth curves for different therapy groups of PBS‐injected, negative siRNA‐injected and MARCH1‐injected tumours, respectively. B and C, Images of representative mice for different therapy groups. D, Tumour weight for different therapy groups. E, Protein expression of MARCH1, PI3K, AKT, P‐AKT, β‐catenin, MCL‐1, BCL‐2, Cleaved caspase‐3 and Cleaved caspase‐7 in the three different therapy tumour tissues with PBS‐injected, negative siRNA‐injected and MARCH1‐injected for four groups samples. F, Model for MARCH1 in PI3K/AKT/β‐catenin signalling. MARCH1 induces PI3K membrane recruitment, which activates phosphorylation and recruitment of AKT, leading to the promotion of β‐catenin expression. Subsequently, the phosphorylation and degradation of β‐catenin is decreased. AKT activation can trigger Mcl‐1 and Bcl‐2 up‐regulation, thus blocking the cytc/caspase‐3/7 pathway. All the data in this figure are represented as mean ± SD. *P < 0.05, **< 0.01
Figure 7
Figure 7
Magnetic resonance imaging (MRI), hematoxylin and eosin (H–E) and IHC of human HCC tumours. A, T1‐weighted MRIs, axial and coronal T2‐weighted MRIs, diffusion‐weighted MRIs and apparent diffusion coefficient (ADC) maps of the PBS‐treated, negative siRNA‐treated and MARCH1 siRNA‐treated tumours. B, Average tumour ADC in the PBS‐treated, negative siRNA‐treated, and MARCH1 siRNA‐treated tumours. C, Average tumour volume acquired on the coronal T2WI in the PBS‐treated, negative siRNA‐treated and MARCH1 siRNA‐treated tumours. D, Positive correlation between the ADC value and tumour volume. E, H–E histology and MARCH1 IHC in the PBS‐treated, negative siRNA‐treated and MARCH1 siRNA‐treated tumour tissue. All the data in this figure are represented as mean ± SD. **< 0.01

Similar articles

Cited by

References

    1. Torre LA, Bray F, Siegel RL, Ferlay J, Lortet‐Tieulent J, Jemal A. Global cancer statistics, 2012. CA Cancer J Clin. 2015;65:87‐108. - PubMed
    1. Hindupur SK, Colombi M, Fuhs SR, et al. The protein histidine phosphatase LHPP is a tumour suppressor. Nature 2018, 555, 678‐682. - PMC - PubMed
    1. Forner A, Reig M, Bruix J. Hepatocellular carcinoma. Lancet. 2018;391:1301‐1314. - PubMed
    1. Feng F, Jiang Q, Jia H, et al. Which is the best combination of TACE and Sorafenib for advanced hepatocellular carcinoma treatment? A systematic review and network meta‐analysis. Pharmacol Res. 2018;135:89‐101. - PubMed
    1. Lencioni R, de Baere T, Soulen MC, Rilling WS, Geschwind JF. Lipiodol transarterial chemoembolization for hepatocellular carcinoma: a systematic review of efficacy and safety data. Hepatology. 2016;64:106‐116. - PubMed

Publication types

MeSH terms