. 2019 Apr;8(4):1558-1566.
doi: 10.1002/cam4.2045. Epub 2019 Feb 21.

Dynamic alterations of plasma cell free DNA in response to chemotherapy in children with neuroblastoma

Affiliations

Dynamic alterations of plasma cell free DNA in response to chemotherapy in children with neuroblastoma

Yan Su et al. Cancer Med. 2019 Apr.

Abstract

Background: To improve cure rates for neuroblastoma (NB), it is important and necessary to evaluate therapy response. Our investigation focuses on using plasma cell free DNA (cfDNA) as a biomarker to determine tumor burden and minimal residual disease (MRD) of NB patients during chemotherapy.

Methods: Total 58 NB patients were recruited from July 2016 to December 2017. Therapy regime and risk classification were based on COG standard and BCH-NB-2007 protocol. RECIST study was used to judge response to therapy at the end of fourth cycle of chemotherapy (CC4) and maintenance stage (MS) respectively. Serial quantifications of cfDNA, NSE, and LDH were examined at four stages, including newly diagnosed, second and CC4, and maintenance.

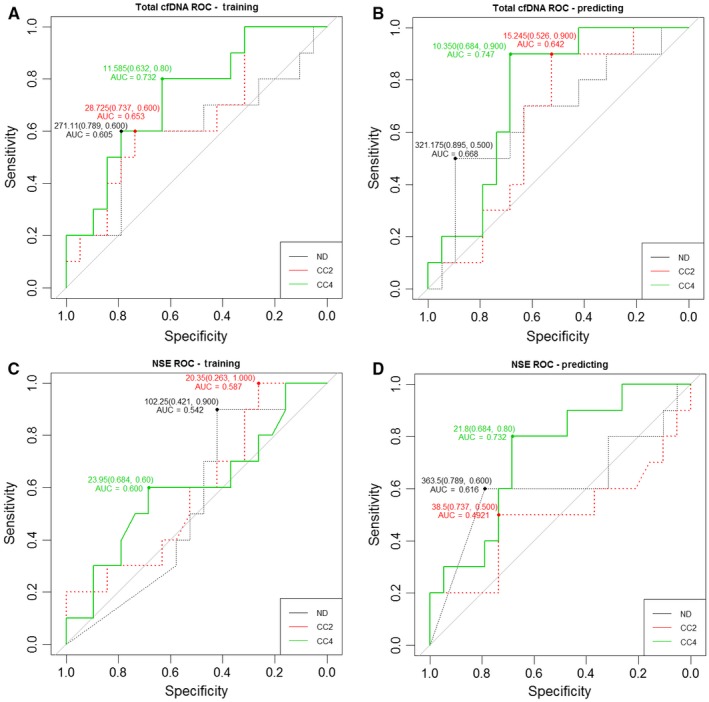
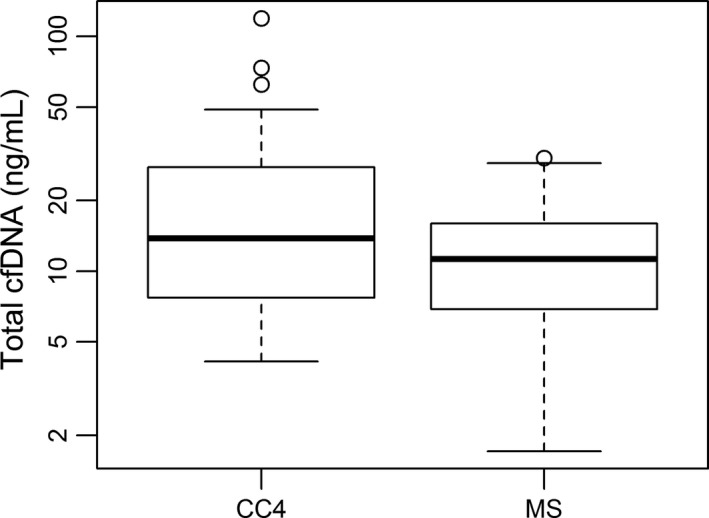
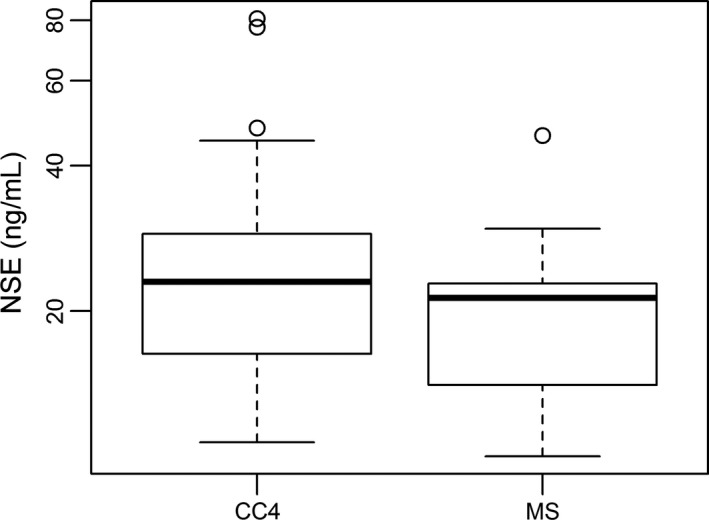
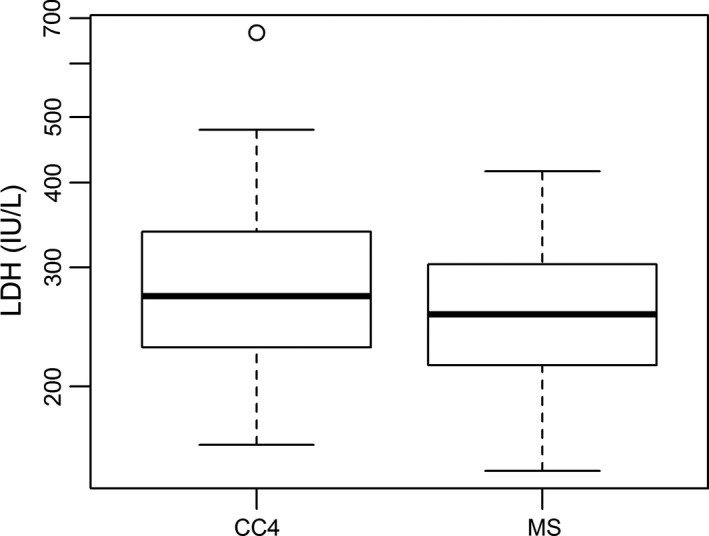
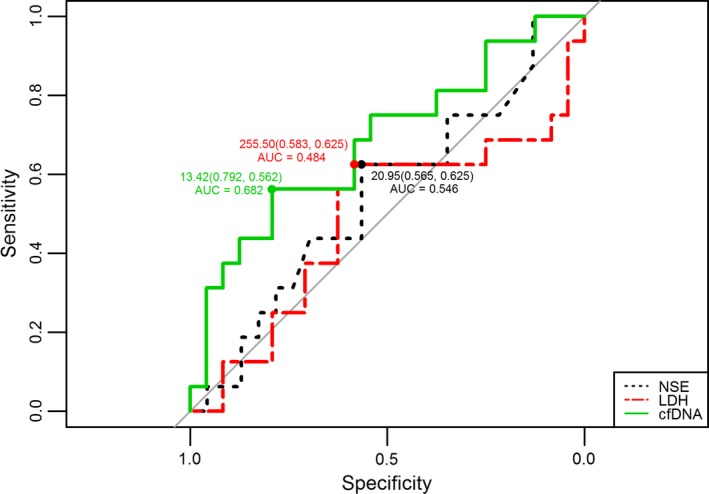
Results: During early chemotherapy, 65.5% of NB kids responded well. Consistently, cfDNA, NSE, and LDH levels were down-regulated in NB patients with partial remission (PR) compared to those with stable disease (SD). In both training and predicting sets, the levels of cfDNA were significantly comparable between PR and SD only at CC4 stage. To predict the insufficient response to early chemotherapy, the optimal AUC value of cfDNA was 0.732 and 0.747 in training and predicting sets respectively, with a sensitivity of 63.2% and 80% specificity at 11.59 ng/ml and a sensitivity of 68.4% and 90% specificity at 10.35 ng/ml. At MS, responded NB patients were slightly increased up to 70%. This evaluation was confirmed by further decrease in cfDNA and NSE levels during intermediate chemotherapy in comparison with early stage.

Conclusion: The dynamic change of cfDNA was considered as a surrogate biomarker to evaluate tumor burden and MRD of NB during early and intermediate therapy periods.

Keywords: dynamic changes; minimal residual disease; neuroblastoma; plasma cell free DNA; therapy response.


Conflict of interest statement

The authors declare that there are no conflicts of interest.

Figures

Figure 1
Figure 1
Receiver‐operating curves (ROC) for predicting insufficient response to early chemotherapy in NB patients by cfDNA and NSE levels. The area under the ROC curve (AUC) of total plasma cfDNA was analyzed both in training set (A) and predicting set (B), respectively. The AUC of NSE was analyzed both in training set (C) and predicting set (D), respectively
Figure 2
Figure 2
Comparison of cfDNA level between NB patients at CC4 and MS (maintenance stage). Box plots for comparison of cfDNA levels in NB patients between CC4 (13.80 ng/ml) and MS (11.25 ng/ml) was significant (P = 0.02, <0.05). (Wilcoxon matched‐pairs signed rank test)
Figure 3
Figure 3
Comparison of NSE level between NB patients at CC4 and MS (maintenance stage). Box plots for comparison of NSE levels in NB patients between CC4 (24.0 ng/ml) and MS (21.30 ng/ml) was significant (P = 0.01, <0.05). (Wilcoxon matched‐pairs signed rank test)
Figure 4
Figure 4
Comparison of LDH level between NB patients at CC4 and MS (maintenance stage). Box plots for comparison of LDH levels in NB patients between CC4 (272.0 IU/L) and MS (255.5 IU/Ll) was not significant (P = 0.11, >0.05). (Wilcoxon matched‐pairs signed rank test)
Figure 5
Figure 5
Receiver‐operating curves (ROC) for predicting insufficient response to intermediate chemotherapy in NB patients by cfDNA, NSE, and LDH levels. The area under the ROC curve (AUC) of total plasma cfDNA was 0.682 (with 79.2% sensitivity and 56.2% specificity at 13.42 ng/ml) at maintenance stage (MS), NSE was 0.546 (with 56.5% sensitivity and 62.5% specificity at 20.95 ng/ml), and LDH was 0.484 (with 58.3% sensitivity and 62.5% specificity at 255.50 IU/L, respectively

Similar articles

Cited by

References

    1. Berthold F, Spix C, Kaatsch P, Lampert F. Incidence, survival, and treatment of localized and metastatic neuroblastoma in Germany 1979–2015. Paediatr Drugs. 2017;19:577‐593. - PMC - PubMed
    1. Dubbers M, Simon T, Berthold F, et al. Retrospective analysis of relapsed abdominal high‐risk neuroblastoma. J Pediatr Surg. 2018;53:558‐566. - PubMed
    1. Irwin MS, Park JR. Neuroblastoma: paradigm for precision medicine. Pediatr Clin North Am. 2015;62:225‐256. - PubMed
    1. London WB, Bagatell R, Weigel BJ, et al. Historical time to disease progression and progression‐free survival in patients with recurrent/refractory neuroblastoma treated in the modern era on Children's Oncology Group early‐phase trials. Cancer. 2017;123:4914‐4923. - PMC - PubMed
    1. Pinto NR, Applebaum MA, Volchenboum SL, et al. Advances in risk classification and treatment strategies for neuroblastoma. J Clin Oncol. 2015;33:3008‐3017. - PMC - PubMed

Publication types

MeSH terms