

Myricanol rescues dexamethasone-induced muscle dysfunction via a sirtuin 1-dependent mechanism
- PMID: 30793539
- PMCID: PMC6463464
- DOI: 10.1002/jcsm.12393
Myricanol rescues dexamethasone-induced muscle dysfunction via a sirtuin 1-dependent mechanism
Abstract
Background: Muscle atrophy and weakness are adverse effects of high dose or the sustained usage of glucocorticoids. Loss of mitochondria and degradation of protein are highly correlated with muscle dysfunction. The deacetylase sirtuin 1 (SIRT1) plays a vital role in muscle remodelling. The current study was designed to identify myricanol as a SIRT1 activator, which could protect skeletal muscle against dexamethasone-induced wasting.
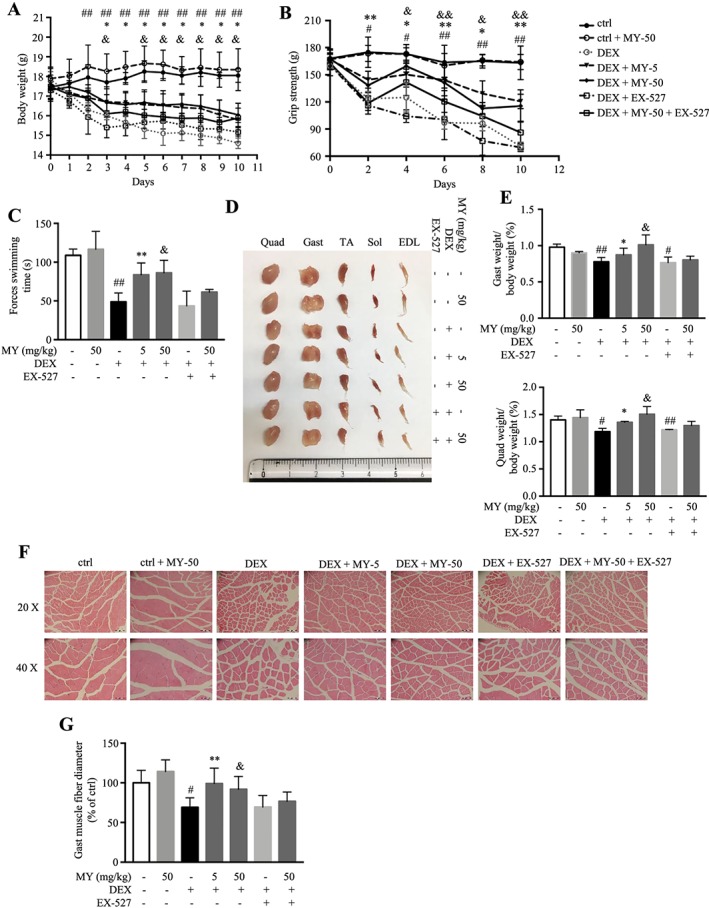
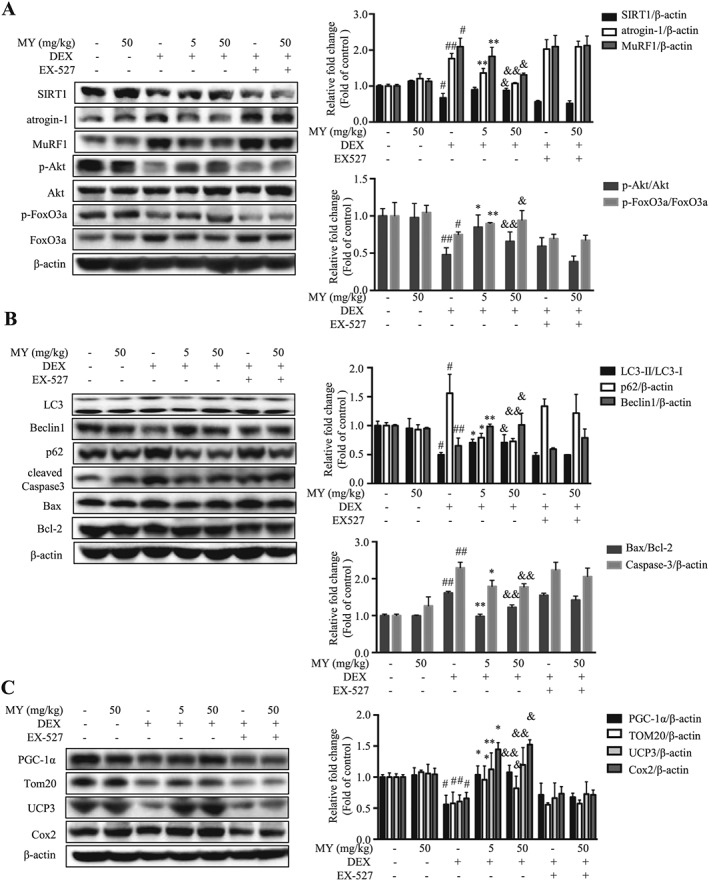
Methods: The dexamethasone-induced atrophy in C2C12 myotubes was evaluated by expression of myosin heavy chain, muscle atrophy F-box (atrogin-1), and muscle ring finger 1 (MuRF1), using western blots. The mitochondrial content and oxygen consumption were assessed by MitoTracker staining and extracellular flux analysis, respectively. Muscle dysfunction was established in male C57BL/6 mice (8-10 weeks old, n = 6) treated with a relatively high dose of dexamethasone (25 mg/kg body weight, i.p., 10 days). Body weight, grip strength, forced swimming capacity, muscle weight, and muscle histology were assessed. The expression of proteolysis-related, autophagy-related, apoptosis-related, and mitochondria-related proteins was analysed by western blots or immunoprecipitation.
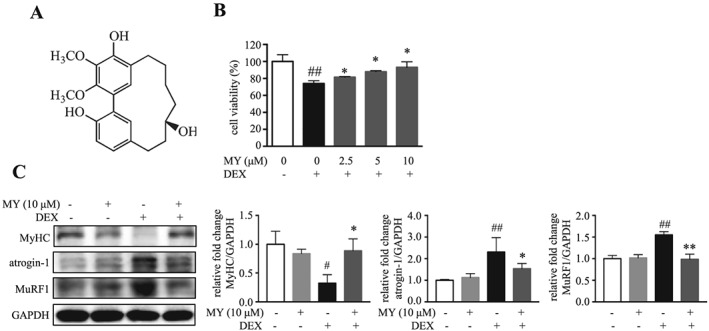
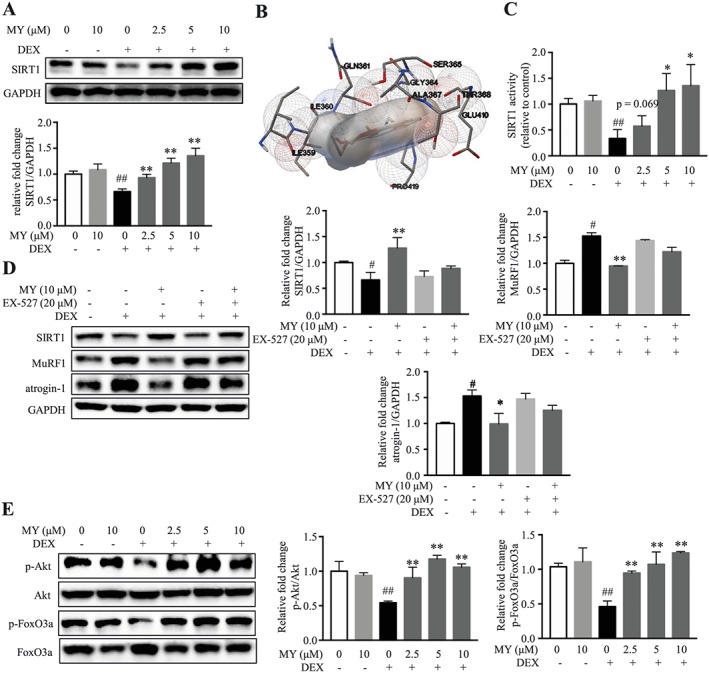
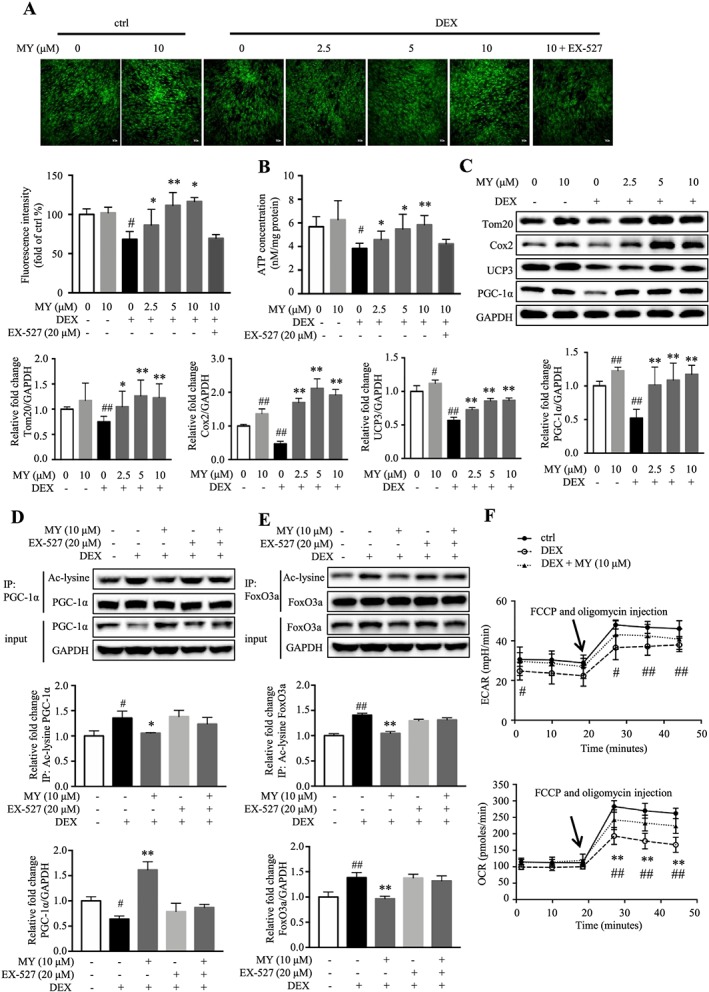
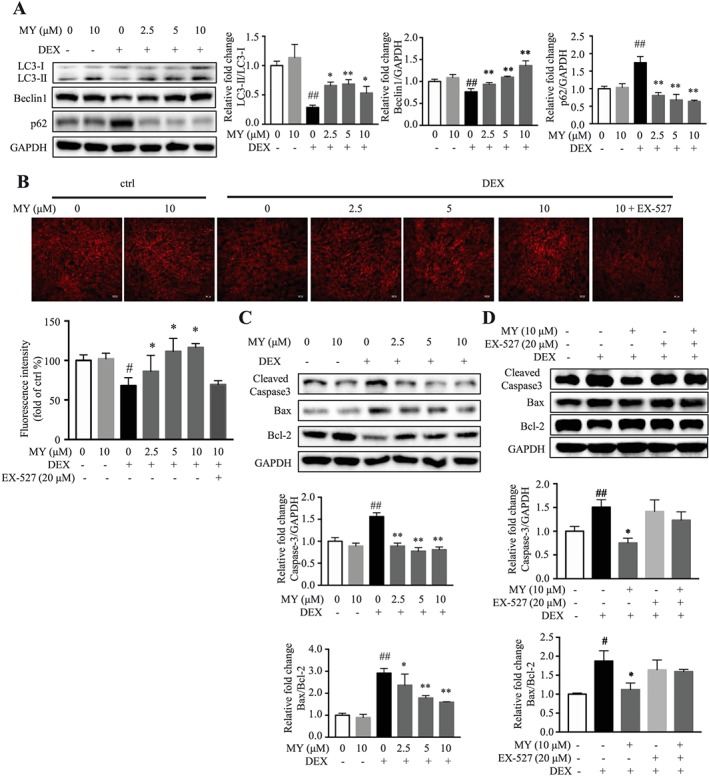
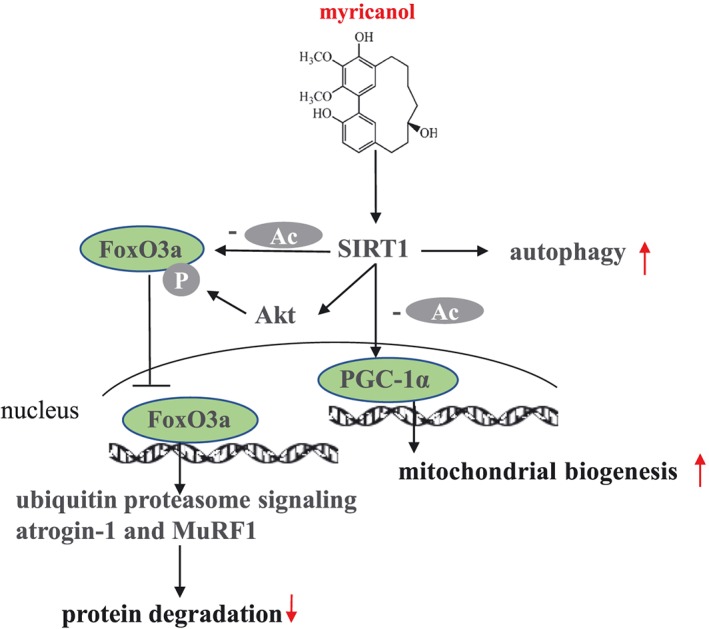
Results: Myricanol (10 μM) was found to rescue dexamethasone-induced muscle atrophy and dysfunction in C2C12 myotubes, indicated by increased expression of myosin heavy chain (0.33 ± 0.14 vs. 0.89 ± 0.21, *P < 0.05), decreased expression of atrogin-1 (2.31 ± 0.67 vs. 1.53 ± 0.25, *P < 0.05) and MuRF1 (1.55 ± 0.08 vs. 0.99 ± 0.12, **P < 0.01), and elevated ATP production (3.83 ± 0.46 vs. 5.84 ± 0.79 nM/mg protein, **P < 0.01), mitochondrial content (68.12 ± 10.07% vs. 116.38 ± 5.12%, *P < 0.05), and mitochondrial oxygen consumption (166.59 ± 22.89 vs. 223.77 ± 22.59 pmol/min, **P < 0.01). Myricanol directly binds and activates SIRT1, with binding energy of -5.87 kcal/mol. Through activating SIRT1 deacetylation, myricanol inhibits forkhead box O 3a transcriptional activity to reduce protein degradation, induces autophagy to enhance degraded protein clearance, and increases peroxisome proliferator-activated receptor γ coactivator-1α activity to promote mitochondrial biogenesis. In dexamethasone-induced muscle wasting C57BL/6 mice, 5 mg/kg myricanol treatment reduces the loss of muscle mass; the percentages of quadriceps and gastrocnemius muscle in myricanol-treated mice are 1.36 ± 0.02% and 0.87 ± 0.08%, respectively (cf. 1.18 ± 0.06% and 0.78 ± 0.05% in dexamethasone-treated mice, respectively). Myricanol also rescues dexamethasone-induced muscle weakness, indicated by improved grip strength (70.90 ± 4.59 vs. 120.58 ± 7.93 g, **P < 0.01) and prolonged swimming exhaustive time (48.80 ± 11.43 vs. 83.75 ± 15.19 s, **P < 0.01). Myricanol prevents dexamethasone-induced muscle atrophy and weakness by activating SIRT1, to reduce muscle protein degradation, enhance autophagy, and promote mitochondrial biogenesis and function in mice.
Conclusions: Myricanol ameliorates dexamethasone-induced skeletal muscle wasting by activating SIRT1, which might be developed as a therapeutic agent for treatment of muscle atrophy and weakness.
Keywords: Autophagy; Dexamethasone; Muscle atrophy; Myricanol; PGC-1α; SIRT1.
© 2019 The Authors. Journal of Cachexia, Sarcopenia and Muscle published by John Wiley & Sons Ltd on behalf of the Society on Sarcopenia, Cachexia and Wasting Disorders.
Conflict of interest statement
The authors declare that there are no conflicts of interest.
Figures
Similar articles
-
Fucoxanthin rescues dexamethasone induced C2C12 myotubes atrophy.Biomed Pharmacother. 2021 Jul;139:111590. doi: 10.1016/j.biopha.2021.111590. Epub 2021 Apr 14. Biomed Pharmacother. 2021. PMID: 33865017
-
Glycyl-l-histidyl-l-lysine-Cu2+ rescues cigarette smoking-induced skeletal muscle dysfunction via a sirtuin 1-dependent pathway.J Cachexia Sarcopenia Muscle. 2023 Jun;14(3):1365-1380. doi: 10.1002/jcsm.13213. Epub 2023 Mar 10. J Cachexia Sarcopenia Muscle. 2023. PMID: 36905132 Free PMC article.
-
Vigeo Promotes Myotube Differentiation and Protects Dexamethasone-Induced Skeletal Muscle Atrophy via Regulating the Protein Degradation, AKT/mTOR, and AMPK/Sirt-1/PGC1α Signaling Pathway In Vitro and In Vivo.Nutrients. 2024 Aug 13;16(16):2687. doi: 10.3390/nu16162687. Nutrients. 2024. PMID: 39203823 Free PMC article.
-
Deacetylation of PGC-1α by SIRT1: importance for skeletal muscle function and exercise-induced mitochondrial biogenesis.Appl Physiol Nutr Metab. 2011 Oct;36(5):589-97. doi: 10.1139/h11-070. Epub 2011 Sep 2. Appl Physiol Nutr Metab. 2011. PMID: 21888529 Review.
-
The Protective Mechanism of SIRT1 in the Regulation of Mitochondrial Biogenesis and Mitochondrial Autophagy in Alzheimer's Disease.J Alzheimers Dis. 2021;82(1):149-157. doi: 10.3233/JAD-210132. J Alzheimers Dis. 2021. PMID: 33998544 Review.
Cited by
-
Small molecule-driven SIRT3-autophagy-mediated NLRP3 inflammasome inhibition ameliorates inflammatory crosstalk between macrophages and adipocytes.Br J Pharmacol. 2020 Oct;177(20):4645-4665. doi: 10.1111/bph.15215. Epub 2020 Aug 20. Br J Pharmacol. 2020. PMID: 32726464 Free PMC article.
-
Gromwell ameliorates glucocorticoid-induced muscle atrophy through the regulation of Akt/mTOR pathway.Chin Med. 2024 Jan 29;19(1):20. doi: 10.1186/s13020-024-00890-5. Chin Med. 2024. PMID: 38287373 Free PMC article.
-
The Role of Sirtuins in Sarcopenia and Frailty.Aging Dis. 2023 Feb 1;14(1):25-32. doi: 10.14336/AD.2022.0622. eCollection 2023 Feb 1. Aging Dis. 2023. PMID: 36818553 Free PMC article.
-
hUC-MSCs and derived exosomes attenuate DEX-induced muscle atrophy through modulation of estrogen signaling pathway.Stem Cell Res Ther. 2025 Aug 2;16(1):419. doi: 10.1186/s13287-025-04328-z. Stem Cell Res Ther. 2025. PMID: 40753405 Free PMC article.
-
Obesity Augments Glucocorticoid-Dependent Muscle Atrophy in Male C57BL/6J Mice.Biomedicines. 2020 Oct 15;8(10):420. doi: 10.3390/biomedicines8100420. Biomedicines. 2020. PMID: 33076257 Free PMC article.
References
-
- Rhen T, Cidlowski JA. Antiinflammatory action of glucocorticoids—new mechanisms for old drugs. N Engl J Med 2005;353:1711–1723. - PubMed
Publication types
MeSH terms
Substances
LinkOut - more resources
Full Text Sources
