. 2019 Feb;24(2):1-10.
doi: 10.1117/1.JBO.24.2.025003.

Development of an integrated multimodal optical imaging system with real-time image analysis for the evaluation of oral premalignant lesions

Affiliations

Development of an integrated multimodal optical imaging system with real-time image analysis for the evaluation of oral premalignant lesions

Eric C Yang et al. J Biomed Opt. 2019 Feb.

Abstract

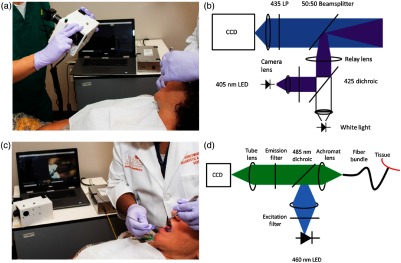
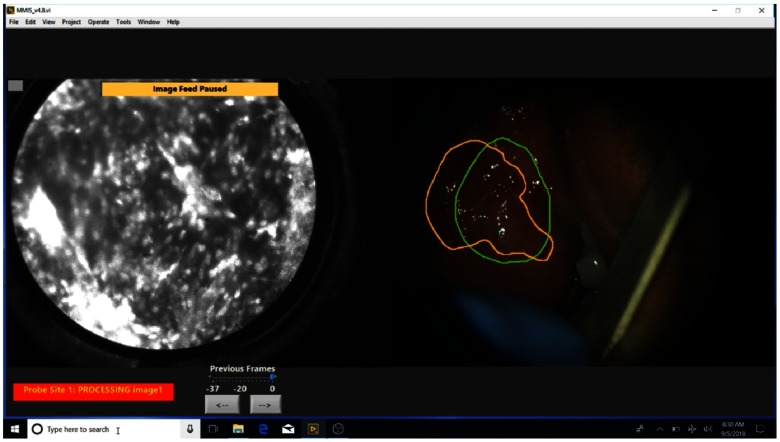
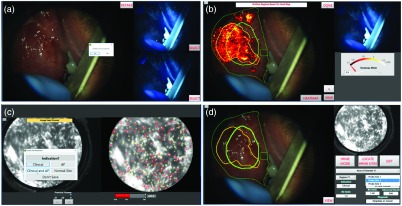
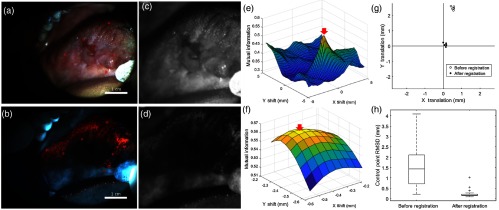
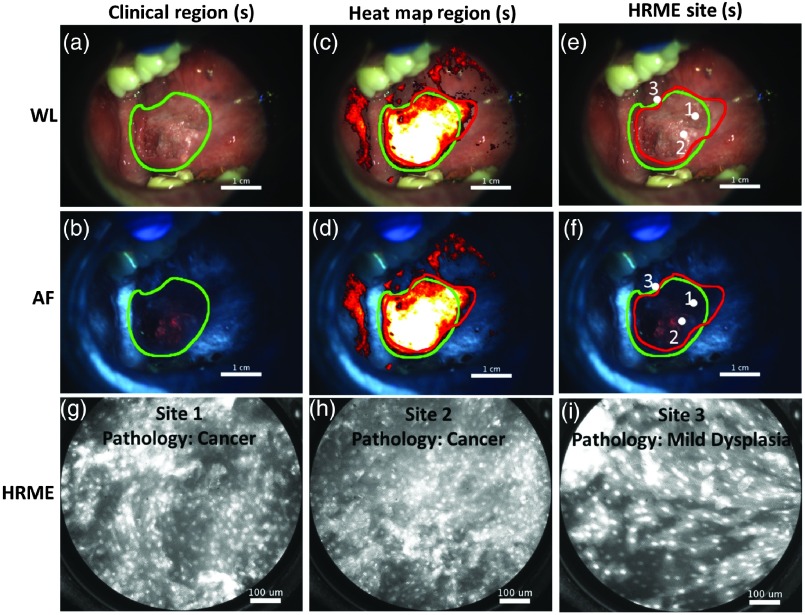
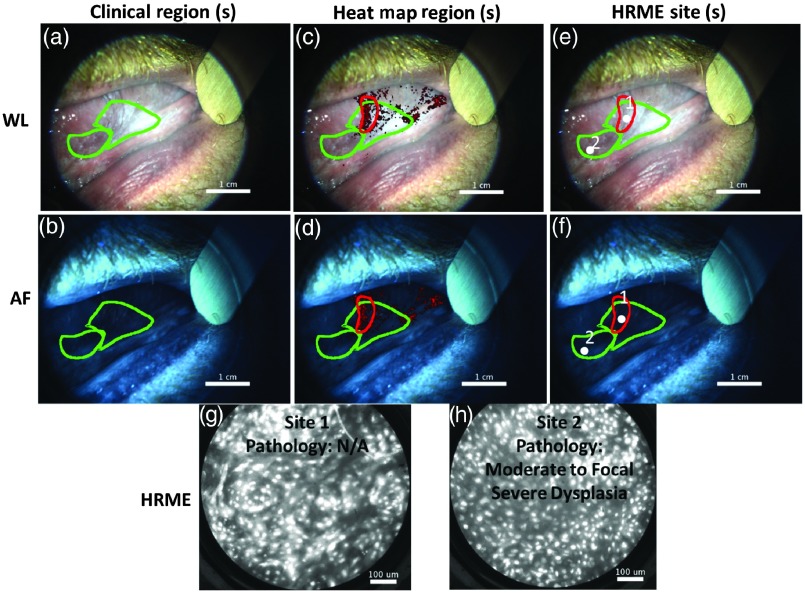
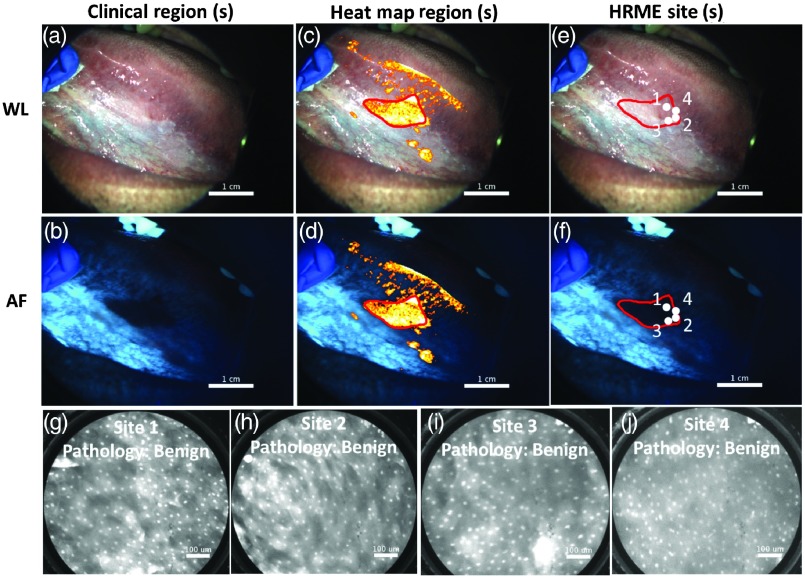
Oral premalignant lesions (OPLs), such as leukoplakia, are at risk of malignant transformation to oral cancer. Clinicians can elect to biopsy OPLs and assess them for dysplasia, a marker of increased risk. However, it is challenging to decide which OPLs need a biopsy and to select a biopsy site. We developed a multimodal optical imaging system (MMIS) that fully integrates the acquisition, display, and analysis of macroscopic white-light (WL), autofluorescence (AF), and high-resolution microendoscopy (HRME) images to noninvasively evaluate OPLs. WL and AF images identify suspicious regions with high sensitivity, which are explored at higher resolution with the HRME to improve specificity. Key features include a heat map that delineates suspicious regions according to AF images, and real-time image analysis algorithms that predict pathologic diagnosis at imaged sites. Representative examples from ongoing studies of the MMIS demonstrate its ability to identify high-grade dysplasia in OPLs that are not clinically suspicious, and to avoid unnecessary biopsies of benign OPLs that are clinically suspicious. The MMIS successfully integrates optical imaging approaches (WL, AF, and HRME) at multiple scales for the noninvasive evaluation of OPLs.

Keywords: autofluorescence; fiber bundle; in vivo imaging; oral cancer; oral lesion.


Figures

Fig. 1
Fig. 1
Multimodal imaging system. (a) Acquisition of widefield WL and AF images of a patient’s OPL. Widefield acquisition occurs with the room lights off; for visualization purposes, the lights were left on. The other MMIS components (touchscreen laptop and HRME instrumentation) are visible in the background. (b) Schematic diagram of widefield WL and AF optical instrumentation. (c) Acquisition of HRME images of a patient’s OPL. The tip of the fiber probe is placed in gentle contact with the OPL after topical application of proflavine dye. (d) Schematic diagram of HRME optical instrumentation.
Fig. 2
Fig. 2
Selected screens during use of the MMIS (Video 1, MP4, 26.5 MB [URL: https://doi.org/10.1117/1.JBO.24.2.025003.1]).
Fig. 3
Fig. 3
MMIS software during multimodal imaging of an OPL patient. For improved visualization, the brightness of panels (a), (b), and (d) has been increased. (a) WL image (left) and two AF images (right) acquired during a single acquisition sequence. Dialog box allows the user to image additional lesions. (b) AF-based heat map overlaid on the WL image (left); suspicious regions based on the heat map (yellow outline) and clinical suspicion (green outline) are visible. The AF image is displayed for reference (top right). The heatmap meter (bottom right) can be adjusted so that the heat map highlights fewer pixels. (c) The HRME image (left) after image analysis (right). The meter (bottom right) displays the number of abnormal nuclei/mm2. (d) Summary screen following imaging procedure. The WL image is displayed (left) with suspicious regions and HRME site locations overlaid. Two dropdown menus are available to select a suspicion region or a probe site and view its normalized RG ratio, HRME risk score, and predicted diagnosis (bottom right). The HRME image corresponding to the selected probe site is displayed in the top right.
Fig. 4
Fig. 4
Image registration algorithm that aligns pairs of widefield WL and AF images. (a) and (b) Example of a WL and AF image pair. The centers of the red circles represent control points. (c) and (d) WL and AF images after preprocessing. (e) MI versus x and y translation at a low resolution. The preliminary translation is indicated by the arrow. Units have been converted from pixels to millimeters. (f) MI versus x and y translation at a high resolution, centered at the preliminary translation. The final translation is indicated by the arrow. Units have been converted from pixels to millimeters. (g) Distance between corresponding control points before (open circles) and after (filled circles) registration, indicating successful registration. (h) Boxplots of the RMSD between corresponding control points for the 28 test set image pairs before and after registration.
Fig. 5
Fig. 5
Example of image registration where the gradient information was necessary for successful registration. (a) and (b) WL and AF image pair. The centers of the red circles represent control points. (c) and (d) WL and AF images after preprocessing. (e) Mutual information versus x and y translation at a low resolution. The preliminary translation is indicated by the filled arrow. Note that this translation was not the local maxima with the highest MI (unfilled arrow). It was selected based on its large gradient. Units have been converted from pixels to millimeters. (f) Mutual information versus x and y translation at a high resolution, centered at the preliminary translation. The final translation is indicated by the arrow. Units have been converted from pixels to millimeters. (g) Distance between corresponding control points before (open circles) and after (filled circles) registration, indicating successful registration.
Fig. 6
Fig. 6
Use of MMIS on a patient immediately prior to surgical resection. (a) and (b) WL and AF image of lesion suspicious for cancer and scheduled for surgical resection. A clinical region, identified by a head and neck surgeon, was outlined (green). (c) and (d) WL and AF image including heat map overlay. An additional suspicious region based on the heat map was outlined (red). (e) and (f) WL and AF images, with HRME sites indicated by white dots. (g), (h), and (i) HRME images acquired from the sites indicated in panels (e) and (f), with corresponding pathologic diagnosis.
Fig. 7
Fig. 7
Example of MMIS identifying focal severe dysplasia that would not otherwise have been identified. (a) and (b) WL and AF images of lesion. Two clinical regions were outlined (green). A biopsy was not clinically indicated. (c) and (d) WL and AF images including heat map overlay. An additional suspicious region based on the heat map was outlined (red). (e) and (f) WL and AF images, with HRME sites indicated (white dots). (g) and (h) HRME images acquired from the sites indicated in panels (e) and (f). A biopsy was acquired at site 2 based on the MMIS results and revealed moderate-to-focal severe dysplasia.
Fig. 8
Fig. 8
Example where MMIS could potentially have prevented an unnecessary biopsy. (a) and (b) WL and AF images of lesion. A biopsy was clinically indicated, although no clinically suspicious regions were outlined. (c) and (d) WL and AF images including heat map overlay. An additional suspicious region based on the heat map was outlined (red). (e) and (f) WL and AF images, with four HRME sites indicated (white dots). (g), (h), (i), and (j) HRME images acquired from the four sites indicated in panels (e) and (f). The biopsy included all four sites and was diagnosed as benign.

Similar articles

Cited by

References

    1. Ferlay J., et al. , “GLOBOCAN 2012 v1.0, cancer incidence and mortality worldwide: IARC CancerBase No. 11,” International Agency for Research on Cancer, Lyon, France, 2013, http://globocan.iarc.fr/Default.aspx (13 November 2016).
    1. Lingen M. W., et al. , “Evidence-based clinical practice guideline for the evaluation of potentially malignant disorders in the oral cavity: a report of the American Dental Association,” J. Am. Dent. Assoc. 148, 712–727 (2017).10.1016/j.adaj.2017.07.032 - DOI - PubMed
    1. Warnakulasuriya S., et al. , “Oral epithelial dysplasia classification systems: predictive value, utility, weaknesses and scope for improvement,” J. Oral Pathol. Med. 37, 127–133 (2008).JPMEEA10.1111/j.1600-0714.2007.00584.x - DOI - PubMed
    1. Lee J.-J., et al. , “Factors associated with underdiagnosis from incisional biopsy of oral leukoplakic lesions,” Oral Surg. Oral Med. Oral Pathol. Oral Radiol. Endodontol. 104, 217–225 (2007).10.1016/j.tripleo.2007.02.012 - DOI - PubMed
    1. Macey R., et al. , “Diagnostic tests for oral cancer and potentially malignant disorders in patients presenting with clinically evident lesions,” in Cochrane Database of Systematic Reviews, Macey R., Ed., p. 4, John Wiley and Sons, Ltd., Hoboken, New Jersey: (2015). - PubMed

Publication types