. 2019 Jul 1;29(1):64-73.
doi: 10.1093/icvts/ivz024.

Effect of stent crimping on calcification of transcatheter aortic valves

Affiliations

Effect of stent crimping on calcification of transcatheter aortic valves

Ramin Zareian et al. Interact Cardiovasc Thorac Surg. .

Abstract

Objectives: Although many challenges related to the acute implantation of transcatheter aortic valves have been resolved, durability and early degeneration are currently the main concerns. Recent reports indicate the potential for early valve degeneration and calcification. However, only little is known about the underlying mechanisms behind the early degeneration of these valves. The goal of this study was to test whether stent crimping increases the risk for early calcification.

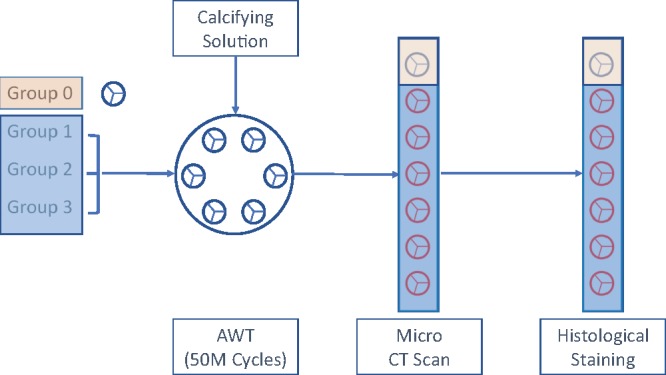
Methods: Stented valves that were crimped at 18-Fr and 14-Fr catheter and uncrimped controls were exposed to a standard calcifying solution for 50 million cycles in an accelerated wear test system. Subsequently, the leaflets of the valves were imaged by microcomputed tomography (micro-CT) followed by histochemical staining and microscopic analyses to quantify calcification and other changes in the leaflets' characteristics.

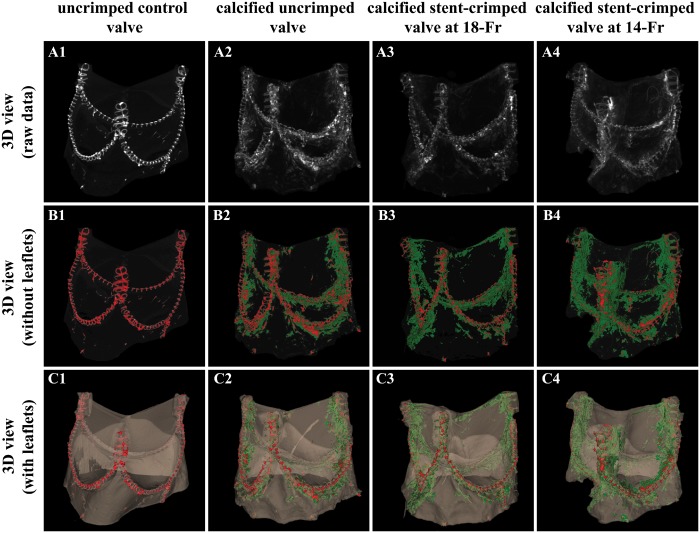
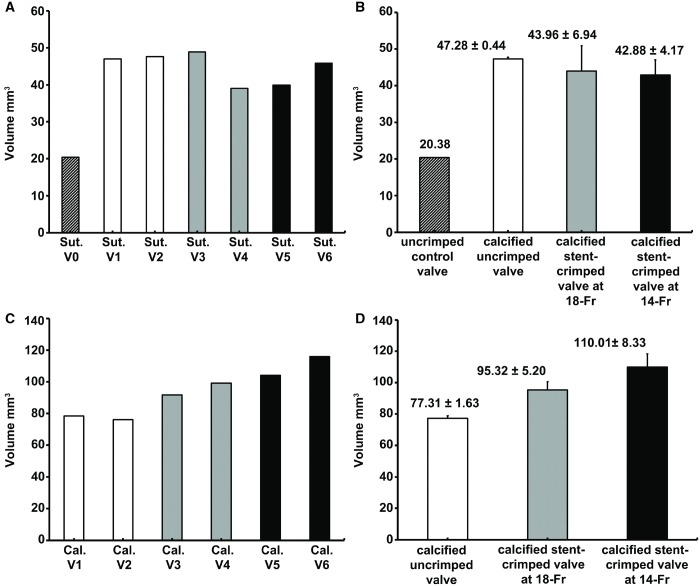
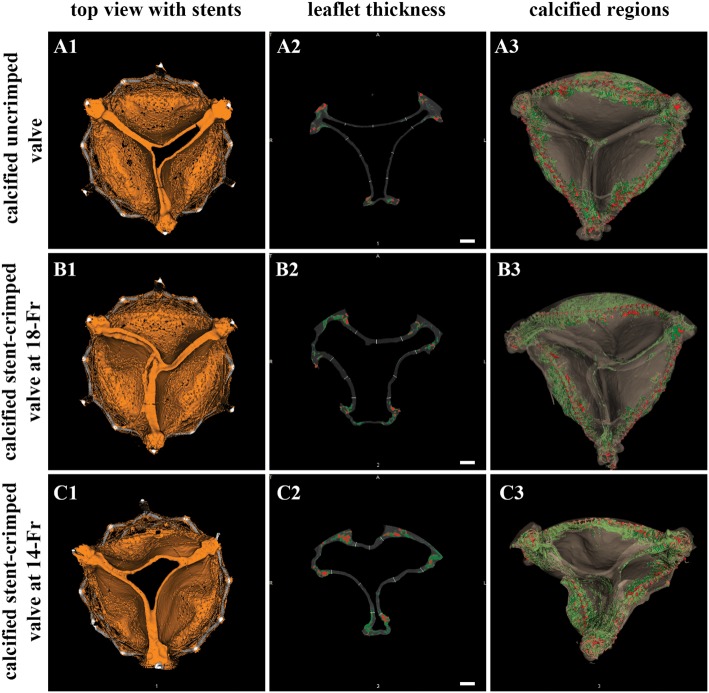
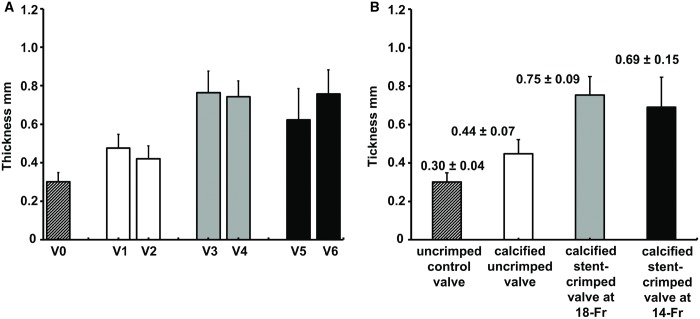
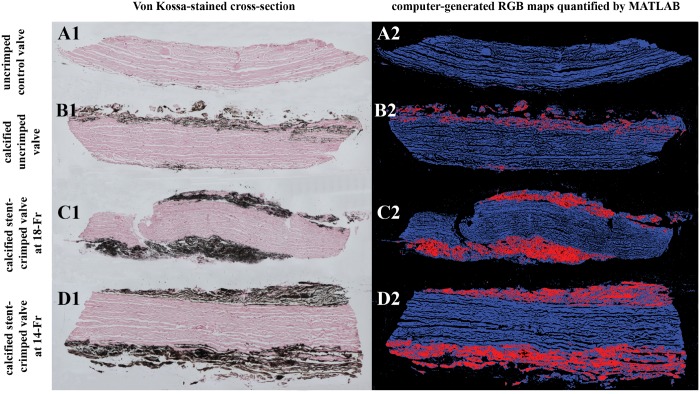
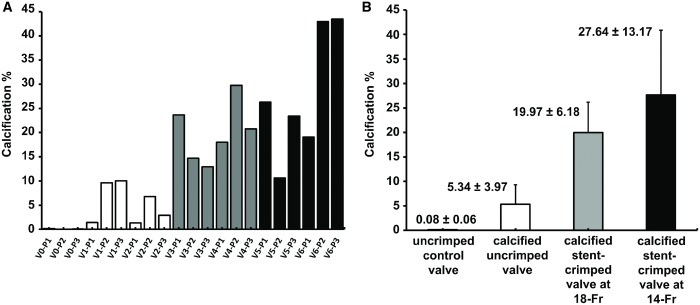
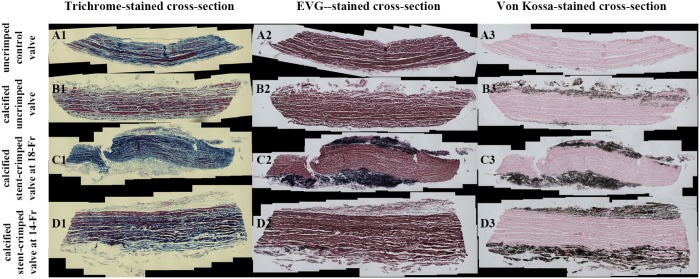
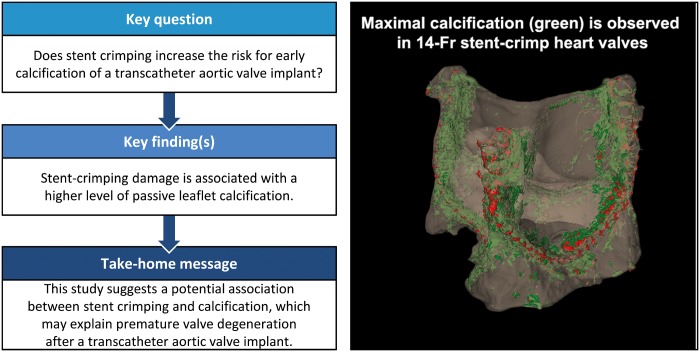
Results: Heavily calcified regions were found over the stent-crimped leaflets compared to uncrimped controls, particularly around the stent's struts. Micro-CT studies measured the total volume of calcification in the uncrimped valves as 77.31 ± 1.63 mm3 vs 95.32 ± 5.20 mm3 in 18-Fr and 110.01 ± 8.33 mm3 in 14-Fr stent-crimped valves, respectively. These results were congruent with the increase in leaflet thickness measured by CT scans (0.44 ± 0.07 mm in uncrimped valves vs 0.69 ± 0.15 mm and 0.75 ± 0.09 mm in 18-Fr and 14-Fr stent-crimped valves, respectively). Histological studies confirmed the micro-CT results, denoting that the percentage of calcification in uncrimped leaflets at the valve's posts was 5.34 ± 3.97 compared to 19.97 ± 6.18 and 27.64 ± 13.17 in the 18-Fr and 14-Fr stent-crimped leaflets, respectively.

Conclusions: This study concludes that stent-crimping damage is associated with a higher level of passive leaflet calcification, which may contribute to early valve degeneration.

Keywords: Calcification; Degeneration; Stent-crimp; Transcatheter aortic valve.


Figures

Figure 1:
Figure 1:
Schematics of the experiments to quantify and compare the durability of heart valves. The diagram shows the 6 valves in groups 1–3 that are tested for durability in the presence of a calcifying solution and then compared with alike control valve in group 0 by microcomputed tomography scans and histological staining. Group 0: control; uncrimped (N = 1); group 1: uncrimped calcified (N = 2); group 2: crimped at 18-Fr calcified (N = 2); and group 3: crimped at 14-Fr and calcified (N = 2). AWT: accelerated wear test; CT: computed tomography.
Figure 2:
Figure 2:
Comparison between stent-crimped and uncrimped valves after 50 million cycles of the accelerated wear test. The raw data representing 3D microcomputed tomographic (micro-CT) scans of an uncrimped control valve (A1); a calcified uncrimped valve (A2); a calcified stent-crimped valve at 18-Fr (A3); and a calcified stent-crimped valve at 14-Fr (A4). The 3D view of the quantified micro-CT images of an uncrimped control valve (B1), a calcified uncrimped valve (B2), a calcified stent-crimped valve at 18-Fr (B3) and calcified stent-crimped valve at 14-Fr (B4) showing the valve’s sutures and calcified regions in red and green, respectively. The 3D views of the quantified micro-CT images of an uncrimped control valve (C1), a calcified uncrimped valve (C2), a calcified stent-crimped valve at 18-Fr (C3) and calcified stent-crimped valve at 14-Fr (C4) along with the valve’s leaflets. 3D: 3-dimensional.
Figure 3:
Figure 3:
Quantification of calcified regions using microcomputed tomographic scanning. (A) Total suture volume was quantified for each valve. (B) The quantified suture volume for each group is shown as the mean ± standard deviation. (C) Total calcification volume is quantified for each valve. (D) The quantified calcification volume for each group is shown as mean ± standard deviation. Cal: calcification; Sut: suture; V0: (valve 0) uncrimped control; V1: (valve 1) calcified uncrimped; V2: (valve 2) calcified uncrimped; V3: (valve 3) calcified crimped valve at 18-Fr; V4: (valve 4) calcified crimped valve at 18-Fr; V5: (valve 5) calcified crimped valve at 14-Fr; V6: (valve 6) calcified crimped valve at 14-Fr.
Figure 4:
Figure 4:
Association between the thickness of the leaflets and calcification. Microcomputed tomographic (micro-CT) views of a calcified uncrimped valve (A1–3); a calcified stent-crimped valve at 18-Fr (B1–3); and a calcified stent-crimped valve at 14-Fr (C1–3). A1, B1 and C1 show the top views of the valves; A2, B2 and C2 show how valves are quantified at each slice from the z-stack. A3, B3 and C3 show the fully analysed CT images of the valve, differentiating between sutures (red) and calcification regions (green), respectively. Scale bars are 2.5 mm.
Figure 5:
Figure 5:
Valve thickness measurement using microcomputed tomographic scanning. (A) The measured thickness of the leaflets for each studied valve. (B) The measured thicknesses of the leaflets for each studied group. The measured thicknesses of the leaflets are shown as the mean ± standard deviation. V0: (valve 0) uncrimped control; V1: (valve 1) calcified uncrimped; V2: (valve 2) calcified uncrimped; V3: (valve 3) calcified stent-crimped valve at 18-Fr; V4: (valve 4) calcified stent-crimped valve at 18-Fr; V5: (valve 5) calcified stent-crimped valve at 14-Fr; V6: (valve 6) calcified stent-crimped valve at 14-Fr.
Figure 6:
Figure 6:
Von Kossa staining for quantifying calcification. The panels compare Von Kossa staining of representative samples of 4 different studied valve groups along with their computer-generated RGB map: a sample from the uncrimped control valve (A1–2); from a calcified uncrimped valve (B1–2); from a calcified stent-crimped valve at 18-Fr (C1–2); and from a calcified stent-crimped valve at 14-Fr (D1–2). A1, B1, C1 and D1 are Von Kossa-stained cross-sections of 4 different valves. Black regions demonstrate the calcification. A2, B2, C2 and D2 are computer-generated RGB maps quantified by an in-house MATLAB routine. Blue and red represent uncalcified and calcified regions, respectively. RGB: red, green and blue.
Figure 7:
Figure 7:
Quantification of calcified regions using histopathological analysis. (A) Total calcification ratio in terms of percentage quantified for each valve’s post according to the computer analyses of the Von Kossa staining. (B) The average calcification in terms of percentage for all the valves’ posts in each studied group is shown as mean ± standard deviation. V0: (valve 0) uncrimped control; V1: (valve 1) calcified uncrimped; V2: (valve 2) calcified uncrimped; V3: (valve 3) calcified stent-crimped valve at 18-Fr; V4: (valve 4) calcified stent-crimped valve at 18-Fr; V5: (valve 5) calcified stent-crimped valve at 14-Fr; V6: (valve 6) calcified stent-crimped valve at 14-Fr; P1, P2 and P3 denote valve posts 1, 2 and 3, respectively. Three punch biopsies were taken from each valve, adjacent to the valve’s post.
Figure 8:
Figure 8:
Association between the leaflet’s extracellular matrix degeneration, elastin degradation and calcification. Trichrome (A1–D1), Elastic tissue fibres - Verhoeff-van Gieson (A2–D2) and Von Kossa staining (A3–D3) of the representative samples from each of the 4 studied groups: an uncrimped control valve (A1–A3); a calcified uncrimped valve (B1–B3); a calcified stent-crimped valve at 18-Fr; and (C1–C3) a calcified stent-crimped valve at 14-Fr (D1–D3). EVG: Elastic tissue fibres - Verhoeff's van Gieson.
None

Similar articles

Cited by

References

    1. Leon MB, Smith CR, Mack MJ, Makkar RR, Svensson LG, Kodali SK. et al. Transcatheter or surgical aortic-valve replacement in intermediate-risk patients. N Engl J Med 2016;374:1609–20. - PubMed
    1. Dvir D, Bourguignon T, Otto CM, Hahn RT, Rosenhek R, Webb JG. et al. Standardized definition of structural valve degeneration for surgical and transcatheter bioprosthetic aortic valves. Circulation 2018;137:388.. - PubMed
    1. Kheradvar A, Groves EM, Goergen CJ, Alavi SH, Tranquillo R, Simmons CA. et al. Emerging trends in heart valve engineering: part II. Novel and standard technologies for aortic valve replacement. Ann Biomed Eng 2015;43:844–57. - PubMed
    1. Zegdi R, Bruneval P, Blanchard D, Fabiani J-N.. Evidence of leaflet injury during percutaneous aortic valve deployment. Eur J Cardiothorac Surg 2011;40:257–60. - PubMed
    1. de Buhr W, Pfeifer S, Slotta-Huspenina J, Wintermantel E, Lutter G, Goetz WA.. Impairment of pericardial leaflet structure from balloon-expanded valved stents. J Thorac Cardiovasc Surg 2012;143:1417–21. - PubMed

Publication types

MeSH terms