

Robust meta-analysis of biobank-based genome-wide association studies with unbalanced binary phenotypes
- PMID: 30793809
- PMCID: PMC6559837
- DOI: 10.1002/gepi.22197
Robust meta-analysis of biobank-based genome-wide association studies with unbalanced binary phenotypes
Abstract
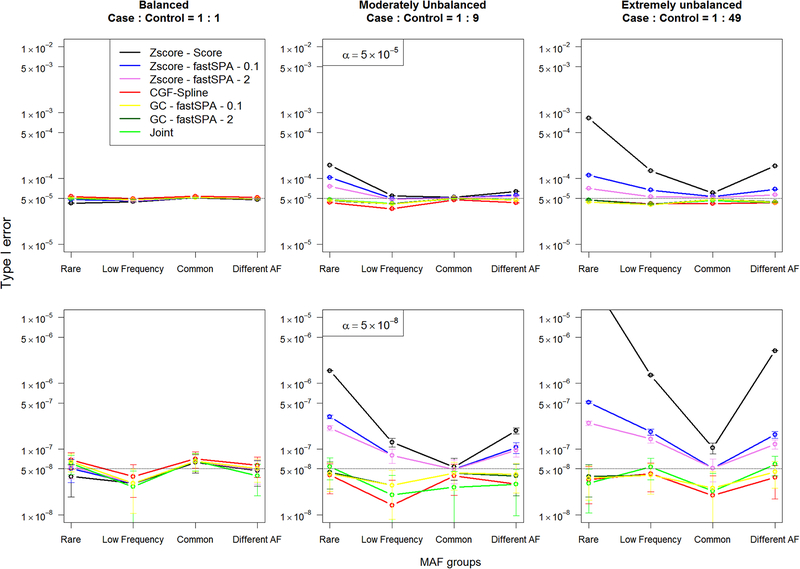
With the availability of large-scale biobanks, genome-wide scale phenome-wide association studies are being instrumental in discovering novel genetic variants associated with clinical phenotypes. As increasing number of such association results from different biobanks become available, methods to meta-analyse those association results is of great interest. Because the binary phenotypes in biobank-based studies are mostly unbalanced in their case-control ratios, very few methods can provide well-calibrated tests for associations. For example, traditional Z-score-based meta-analysis often results in conservative or anticonservative Type I error rates in such unbalanced scenarios. We propose two meta-analysis strategies that can efficiently combine association results from biobank-based studies with such unbalanced phenotypes, using the saddlepoint approximation-based score test method. Our first method involves sharing the overall genotype counts from each study, and the second method involves sharing an approximation of the distribution of the score test statistic from each study using cubic Hermite splines. We compare our proposed methods with a traditional Z-score-based meta-analysis strategy using numerical simulations and real data applications, and demonstrate the superior performance of our proposed methods in terms of Type I error control.
Keywords: GWAS; biobank; case-control studies; meta-analysis; saddlepoint approximation.
© 2019 Wiley Periodicals, Inc.
Figures


Similar articles
-
A Fast and Accurate Method for Genome-wide Scale Phenome-wide G × E Analysis and Its Application to UK Biobank.Am J Hum Genet. 2019 Dec 5;105(6):1182-1192. doi: 10.1016/j.ajhg.2019.10.008. Epub 2019 Nov 14. Am J Hum Genet. 2019. PMID: 31735295 Free PMC article.
-
UK Biobank Whole-Exome Sequence Binary Phenome Analysis with Robust Region-Based Rare-Variant Test.Am J Hum Genet. 2020 Jan 2;106(1):3-12. doi: 10.1016/j.ajhg.2019.11.012. Epub 2019 Dec 19. Am J Hum Genet. 2020. PMID: 31866045 Free PMC article.
-
A Fast and Accurate Algorithm to Test for Binary Phenotypes and Its Application to PheWAS.Am J Hum Genet. 2017 Jul 6;101(1):37-49. doi: 10.1016/j.ajhg.2017.05.014. Epub 2017 Jun 8. Am J Hum Genet. 2017. PMID: 28602423 Free PMC article.
-
Scalable and Robust Regression Methods for Phenome-Wide Association Analysis on Large-Scale Biobank Data.Front Genet. 2021 Jun 15;12:682638. doi: 10.3389/fgene.2021.682638. eCollection 2021. Front Genet. 2021. PMID: 34211504 Free PMC article. Review.
-
Statistical Learning Methods Applicable to Genome-Wide Association Studies on Unbalanced Case-Control Disease Data.Genes (Basel). 2021 May 13;12(5):736. doi: 10.3390/genes12050736. Genes (Basel). 2021. PMID: 34068248 Free PMC article. Review.
Cited by
-
Establishing a Structured Hypospadias Biobank Cohort for Integrated Research: Methodology, Comprehensive Database Integration, and Phenotyping.Diagnostics (Basel). 2025 Feb 26;15(5):561. doi: 10.3390/diagnostics15050561. Diagnostics (Basel). 2025. PMID: 40075808 Free PMC article.
-
A Fast and Accurate Method for Genome-wide Scale Phenome-wide G × E Analysis and Its Application to UK Biobank.Am J Hum Genet. 2019 Dec 5;105(6):1182-1192. doi: 10.1016/j.ajhg.2019.10.008. Epub 2019 Nov 14. Am J Hum Genet. 2019. PMID: 31735295 Free PMC article.
-
Efficient and accurate frailty model approach for genome-wide survival association analysis in large-scale biobanks.Nat Commun. 2022 Sep 16;13(1):5437. doi: 10.1038/s41467-022-32885-x. Nat Commun. 2022. PMID: 36114182 Free PMC article.
-
A Fast and Accurate Method for Genome-Wide Time-to-Event Data Analysis and Its Application to UK Biobank.Am J Hum Genet. 2020 Aug 6;107(2):222-233. doi: 10.1016/j.ajhg.2020.06.003. Epub 2020 Jun 25. Am J Hum Genet. 2020. PMID: 32589924 Free PMC article.
-
Cross-ancestry genome-wide meta-analysis of 61,047 cases and 947,237 controls identifies new susceptibility loci contributing to lung cancer.Nat Genet. 2022 Aug;54(8):1167-1177. doi: 10.1038/s41588-022-01115-x. Epub 2022 Aug 1. Nat Genet. 2022. PMID: 35915169 Free PMC article.
References
-
- Barndorff-Nielsen OE (1990). Approximate Interval Probabilities. Journal of the Royal Statistical Society. Series B (Methodological), 52(3), 485–496.
-
- Brent RP (1973). Algorithms for Minimization without Derivatives. Englewood Cliffs, NJ: Prentice-Hall.
-
- Bycroft C, Freeman C, Petkova D, Band G, Elliott LT, Sharp K, … Marchini J (2017). Genome-wide genetic data on ~500,000 UK Biobank participants. bioRxiv 166298 doi:10.1101/166298. - DOI
-
- Cooper HM, Hedges LV, & Valentine JC (2009). The handbook of research synthesis and meta-analysis (2nd ed.). New York: Russell Sage Foundation.
-
- Daniels HE (1954). Saddlepoint Approximations in Statistics. Annals of Mathematical Statistics, 25(4), 631–650. doi:10.1214/aoms/1177728652 - DOI
Publication types
MeSH terms
Grants and funding
LinkOut - more resources
Full Text Sources
Research Materials
