

Assessment of Changes in the Geographical Distribution of Opioid-Related Mortality Across the United States by Opioid Type, 1999-2016
- PMID: 30794299
- PMCID: PMC6484620
- DOI: 10.1001/jamanetworkopen.2019.0040
Assessment of Changes in the Geographical Distribution of Opioid-Related Mortality Across the United States by Opioid Type, 1999-2016
Abstract
Importance: As the opioid epidemic evolves, it is vital to identify changes in the geographical distribution of opioid-related deaths, and the specific opioids to which those deaths are attributed, to ensure that federal and state public health interventions remain appropriately targeted.
Objective: To identify changes in the geographical distribution of opioid-related mortality across the United States by opioid type.
Design, setting, and participants: Cross-sectional study using joinpoint modeling and life table analysis of individual-level data from the National Center for Health Statistics on 351 630 US residents who died from opioid-related causes from January 1, 1999, to December 31, 2016, for all of the United States and the District of Columbia. The analysis was conducted from September 6 to November 23, 2018.
Exposures: Deaths involving any opioid, heroin, synthetic opioids, and natural and semisynthetic opioids.
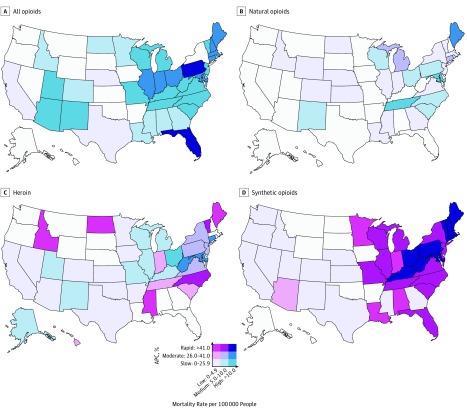
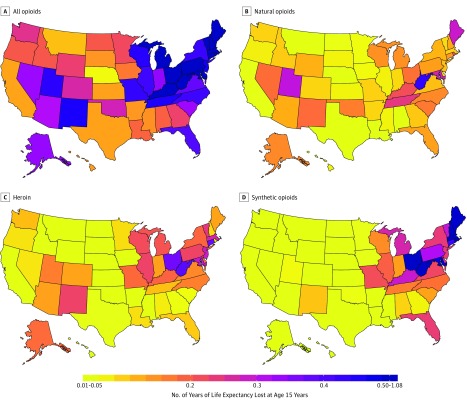
Main outcomes and measures: Opioid-related mortality rate, annual percent change in the opioid-related mortality rate, and life expectancy lost at age 15 years by state and opioid type.
Results: From 1999 to 2016, a total of 231 264 men and 120 366 women died from opioid-related causes across the whole United States. Sixty-six observations were removed owing to missing data on age; therefore, 351 564 US residents were included in this study. The mean (SD) age at death was 39.8 (12.5) years for men and was 43.5 (12.9) years from women. Opioid-related mortality rates, especially from synthetic opioids, rapidly increased in all of the eastern United States. In most states, mortality associated with natural and semisynthetic opioids (ie, prescription painkillers) remained stable. In contrast, 28 states had mortality rates from synthetic opioids that more than doubled every 2 years (ie, annual percent change, ≥41%), including 12 with high mortality rates from synthetic opioids (>10 per 100 000 people). Among these 28 states, the mortality rate from natural and semisynthetic opioids ranged from 2.0 to 18.7 per 100 000 people (with a mean mortality rate of 6.0 per 100 000 people). The District of Columbia had the fastest rate of increase in mortality from opioids, more than tripling every year since 2013 (annual percent change, 228.3%; 95% CI, 169.7%-299.6%; P < .001), and a high mortality rate from synthetic opioids in 2016 (18.8 per 100 000 people); the mortality rate from natural and semisynthetic opioids was 6.9 per 100 000 people. Nationally, overall opioid-related mortality resulted in 0.36 years of life expectancy lost in 2016, which was 14% higher than deaths due to firearms and 18% higher than deaths due to motor vehicle crashes; 0.17 years of the life expectancy lost was due specifically to synthetic opioids. In 2016, New Hampshire and West Virginia lost more than 1 year of life expectancy due to opioid-related mortality.
Conclusions and relevance: Opioid-related mortality, particularly mortality associated with synthetic opioids, has increased in the eastern United States. These findings indicate that policies focused on reducing opioid-related deaths may need to prioritize synthetic opioids and rapidly expanding epidemics in northeastern states and consider the potential for synthetic opioid epidemics outside of the heroin supply.
Conflict of interest statement
Figures
References
-
- Davis JH. Trump declares opioid crisis a ‘health emergency’ but requests no funds. New York Times https://www.nytimes.com/2017/10/26/us/politics/trump-opioid-crisis.html. Published October 26, 2017. Accessed November 23, 2018.
Publication types
MeSH terms
Substances
Grants and funding
LinkOut - more resources
Full Text Sources
Research Materials
