. 2019 May;189(5):1091-1104.
doi: 10.1016/j.ajpath.2019.02.002. Epub 2019 Feb 19.

β-Catenin and Yes-Associated Protein 1 Cooperate in Hepatoblastoma Pathogenesis

Affiliations

β-Catenin and Yes-Associated Protein 1 Cooperate in Hepatoblastoma Pathogenesis

Qian Min et al. Am J Pathol. 2019 May.

Erratum in

  • Correction.
    [No authors listed] [No authors listed] Am J Pathol. 2019 Aug;189(8):1680. doi: 10.1016/j.ajpath.2019.06.003. Am J Pathol. 2019. PMID: 31345468 Free PMC article. No abstract available.

Abstract

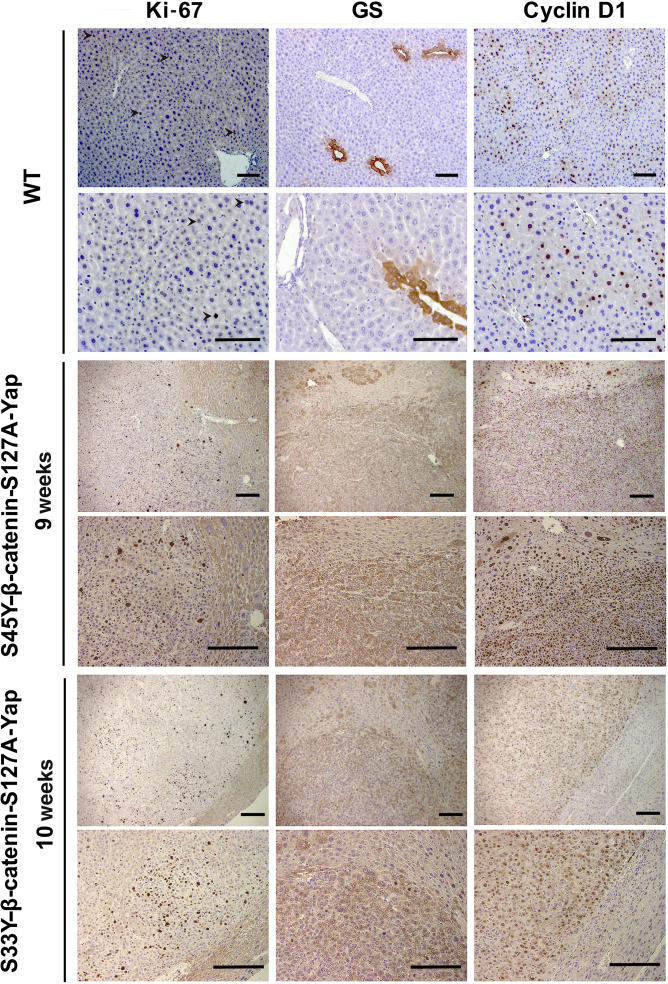
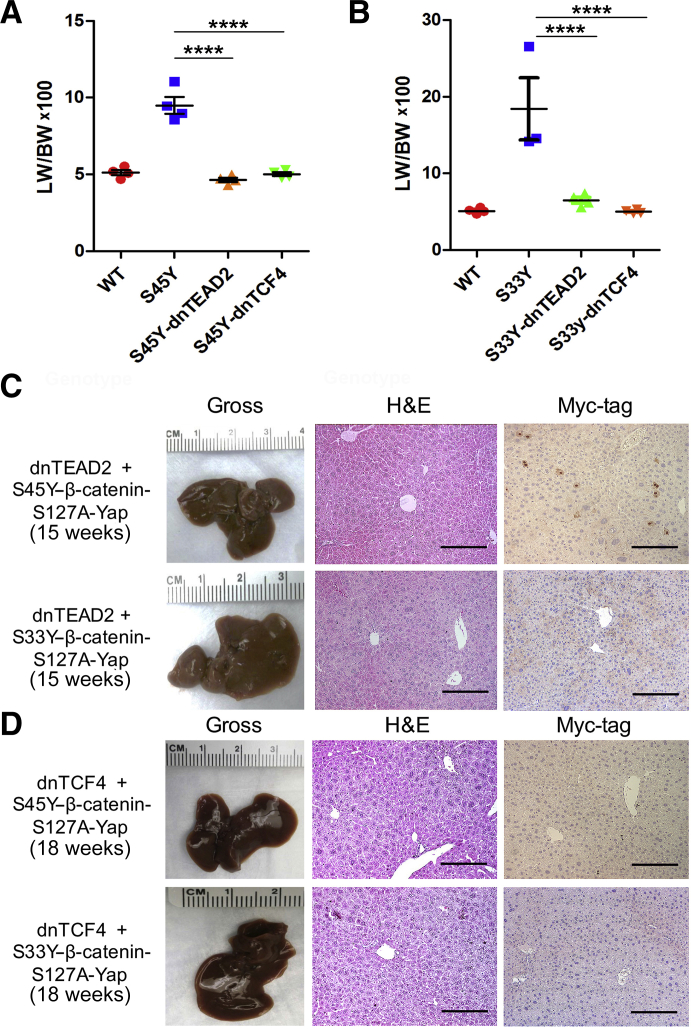
Hepatoblastoma (HB), the most common pediatric primary liver neoplasm, shows nuclear localization of β-catenin and yes-associated protein 1 (YAP1) in almost 80% of the cases. Co-expression of constitutively active S127A-YAP1 and ΔN90 deletion-mutant β-catenin (YAP1-ΔN90-β-catenin) causes HB in mice. Because heterogeneity in downstream signaling is being identified owing to mutational differences even in the β-catenin gene alone, we investigated if co-expression of point mutants of β-catenin (S33Y or S45Y) with S127A-YAP1 led to similar tumors as YAP1-ΔN90-β-catenin. Co-expression of S33Y/S45Y-β-catenin and S127A-YAP1 led to activation of Yap and Wnt signaling and development of HB, with 100% mortality by 13 to 14 weeks. Co-expression with YAP1-S45Y/S33Y-β-catenin of the dominant-negative T-cell factor 4 or dominant-negative transcriptional enhanced associate domain 2, the respective surrogate transcription factors, prevented HB development. Although histologically similar, HB in YAP1-S45Y/S33Y-β-catenin, unlike YAP1-ΔN90-β-catenin HB, was glutamine synthetase (GS) positive. However, both ΔN90-β-catenin and point-mutant β-catenin comparably induced GS-luciferase reporter in vitro. Finally, using a previously reported 16-gene signature, it was shown that YAP1-ΔN90-β-catenin HB tumors exhibited genetic similarities with more proliferative, less differentiated, GS-negative HB patient tumors, whereas YAP1-S33Y/S45Y-β-catenin HB exhibited heterogeneity and clustered with both well-differentiated GS-positive and proliferative GS-negative patient tumors. Thus, we demonstrate that β-catenin point mutants can also collaborate with YAP1 in HB development, albeit with a distinct molecular profile from the deletion mutant, which may have implications in both biology and therapy.


Figures

Figure 1
Figure 1
Establishment of a hepatoblastoma (HB) model by co-expression of point-mutant β-catenin and YAP1. A: Schematic representation of establishment of an HB model, experimental treatments, and timeline. B: Liver weight (LW)/body weight (BW) ratio shows approximately 5% of BW to be contributed by LW in 10- to 12-week–old wild-type (WT) mice, whereas age-matched S33Y–β-catenin-S127A-YAP1 at 10 to 12 weeks after sleeping-beauty hydrodynamic tail vein injection (SB-HTVI) and S45Y–β-catenin-S127A-YAP1 at 8 to 10 weeks after SB-HTVI show, on average, approximately 17% or 18% of BW to be contributed by LW, indicating significant tumorigenesis. C: Gross liver images from S45Y–β-catenin-S127A-YAP1 and S33Y–β-catenin-S127A-YAP1 mice at 5 and 9 to 10 weeks after SB-HTVI, showing progressive macroscopic disease. D: Hematoxylin and eosin (H&E)–stained sections from WT mouse as well as S45Y–β-catenin-S127A-YAP1 and S33Y–β-catenin-S127A-YAP1 mice at 9 to 10 weeks after SB-HTVI, showing HB with more differentiated fetal or crowded fetal histology in both tumor groups. E: Immunohistochemistry shows strong nuclear staining of Myc-tag (representing the presence of exogenous point-mutant β-catenin) and YAP1 in livers from S45Y–β-catenin-S127A-YAP1 and S33Y–β-catenin-S127A-YAP1 mice at 9 to 10 weeks after SB-HTVI. F: Western blot analysis for Myc-tag in S45Y–β-catenin-S127A-YAP1 and S33Y–β-catenin-S127A-YAP1 mice at 9 to 10 weeks after SB-HTVI. P < 0.05. Scale bars: 100 μm (D); 200 μm (E). Original magnification: ×100 (D); ×50 (E).
Figure 2
Figure 2
Immunohistochemical characterization of hepatoblastoma (HB) in S45Y–β-catenin-S127A-YAP1 and S33Y-β-catenin-S127A-YAP1 mice. Representative immunohistochemical analysis of liver sections from wild-type (WT) mice as well as S45Y–β-catenin-S127A-YAP1 and S33Y–β-catenin-S127A-YAP1 mice at 9 to 10 weeks after hydrodynamic tail vein injection, showing HB to be positive for proliferation marker Ki-67 and β-catenin targets glutamine synthetase (GS) and cyclin D1. Arrowheads indicate the few Ki-67–positive cells in the WT liver. Scale bars = 100 μm.
Figure 3
Figure 3
Characterization of hepatoblastoma in S45Y–β-catenin-S127A-YAP1 and S33Y–β-catenin-S127A-YAP1 mice by analysis of liver lysates. Western blot analysis using lysates from the same groups of mice shows increased levels of β-catenin targets glutamine synthetase (GS), cyclin D1, and regucalcin, as well as YAP1 targets survivin, Cyr61, and jagged 1, compared with wild-type (WT) livers from age-matched mice. Glyceraldehyde-3–phosphate dehydrogenase (GAPDH) verified comparable loading. Molecular weights are indicated to the right of each blot. Arrows indicate the correct molecular weight band.
Figure 4
Figure 4
Analysis of hepatoblastoma tumorigenesis in S45Y–β-catenin-S127A-YAP1 and S33Y–β-catenin-S127A-YAP1 mice in the presence of dnTEAD2 and dnTCF4. A: Liver weight (LW)/body weight (BW) ratio shows approximately 5% of BW to be contributed by LW in 10- to 12-week–old wild-type (WT) mice, whereas age-matched S45Y–β-catenin-S127A-YAP1 co-injected at the time of injection with PT3 plasmid (backbone for dnTCF/dnTEAD) at 8 to 12 weeks after sleeping-beauty hydrodynamic tail vein injection (SB-HTVI) shows, on average, approximately 9% of BW. Concomitant introduction at the time of SB-HTVI of dnTEAD2 or dnTCF4 led to a highly significant decrease in LW/BW ratio comparable to WT, even up to 20 weeks. B: LW/BW ratio shows approximately 5% of BW to be contributed by LW in 10- to 12-week–old WT mice, whereas age-matched S33Y–β-catenin-S127A-YAP1 co-injected at the time of injection with PT3 plasmid (backbone for dnTCF/dnTEAD) at 8 to 13 weeks after SB-HTVI shows, on average, approximately 18% of BW. Concomitant introduction at the time of SB-HTVI of dnTEAD2 or dnTCF4 leads to a highly significant decrease in LW/BW comparable to WT, even up to 20 weeks. C: Gross liver images and hematoxylin and eosin (H&E)– and Myc-tag–stained sections from dnTEAD2 expressing S45Y–β-catenin-S127A-YAP1 and S33Y–β-catenin-S127A-YAP1 mice 15 weeks after injection. D: Gross liver images and H&E- and Myc-tag–stained sections from dnTCF4 expressing S45Y–β-catenin-S127A-YAP1 and S33Y–β-catenin-S127A-YAP1 mice 18 weeks after injection. ∗∗∗∗P < 0.0001. Scale bars = 100 μm (C and D).
Figure 5
Figure 5
Characterization of livers in dnTEAD2 or dnTCF4 + S45Y–β-catenin-S127A-YAP1 or S33Y–β-catenin-S127A-YAP1 mice. A: Representative immunohistochemistry of liver sections shows lack of Ki-67–positive cells in the S45Y–β-catenin-YAP1-dnTEAD2 and S33Y–β-catenin-YAP1-dnTEAD2 groups. Cyclin D1 was normalized to its midzonal expression in S45Y/S33Y–β-catenin-YAP1-dnTEAD2 groups. Glutamine synthetase (GS) was normalized to its predominantly pericentral expression, with only a few random GS-positive hepatocytes (arrowheads) staying in the S45Y/S33Y–β-catenin-YAP1-dnTEAD2 groups. More frequent GS-positive cells and occasionally a few cell clusters of GS-positive hepatocytes are seen in the S33Y–β-catenin-YAP1-dnTEAD2 group. B: Representative immunohistochemistry of liver sections shows lack of Ki-67–positive cells in the S45Y–β-catenin-YAP1-dnTCF4 and S33Y–β-catenin-YAP1-dnTCF4 groups. Cyclin D1 was normalized to its midzonal expression in the S45Y/S33Y–β-catenin-YAP1-dnTCF4 groups, as was GS to its predominantly pericentral expression. Scale bars = 100 μm (A and B). Original magnification, ×100 (A and B).
Figure 6
Figure 6
Protein expression of Wnt and YAP1 targets in dnTEAD2 or dnTCF4 + S45Y–β-catenin-S127A-YAP1 or S33Y–β-catenin-S127A-YAP1 livers. A: Western blot analysis of β-catenin targets glutamine synthetase (GS), cyclin D1, and regucalcin, as well as YAP1 targets survivin, Cyr61, and jagged 1, with or without dnTEAD2 or dnTCF4 in S45Y–β-catenin-S127A-YAP1 mice. All targets that were increased in S45Y–β-catenin-S127A-YAP1 livers relative to wild type (WT) are notably decreased with co-introduction of dnTCF4 or dnTEAD2. Arrows indicate the correct molecular weight. Molecular weights of each protein are indicated to the right. Glyceraldehyde-3–phosphate dehydrogenase (GAPDH) verifies comparable protein loading. B: Western blot analysis of β-catenin targets GS, cyclin D1, and regucalcin, as well as YAP1 targets survivin, Cyr61, and jagged 1, with or without dnTEAD2 or dnTCF4 in S33Y–β-catenin-S127A-YAP1 mice. All targets that are increased in S33Y–β-catenin-S127A-YAP1 livers relative to WT are notably decreased with co-introduction of dnTCF4. However, GS is completely unaffected and cyclin D1 is only modestly affected in S33Y–β-catenin-S127A-YAP1-dnTEAD2 livers. Arrow indicates the correct molecular weight. Molecular weights of each protein are indicated to the right. GAPDH verifies comparable protein loading.
Figure 7
Figure 7
Glutamine synthetase (GS) expression and regulation in deletion- versus point-mutant hepatoblastoma (HB). A: Two representative images from immunohistochemical staining for GS show HB tumors (Tu.) to be GS negative in the ΔN90–β-catenin-YAP1 model (top row). However, Tu. occurring in the S45Y–β-catenin-YAP1 mice (bottom left panel) or in the S33Y–β-catenin-YAP1 mice (bottom right panel) are strongly and uniformly GS positive. B: Left panel: Reporter gene assays were performed with 5′ sequences from the rat Glul gene containing the Glul 5′-enhancer region located between −2516 and −2146 upstream from the transcriptional start point (HEV) and reporter genes with deletions within this region [HEV-del TCF, HEV-del STAT5, and HEV-del specificity protein 1 (SP1)] controlling a firefly luciferase. These reporters were transfected into mouse hepatocytes from two independent liver preparations either without a cotransfected expression plasmid (control) or together with a ΔN90-β-catenin expression plasmid or an S33Y–β-catenin expression plasmid. In addition, a reporter gene with the rat Glul upstream region from −3780 down to 105, including the non-translated mRNA sequence from the Glul gene (HHN), was transfected. The relative level of expression was determined from a cotransfected reference reporter expressing Renilla luciferase. Right panel: All values depicted are normalized to the relative expression of the HEV reporter transfected without an expression plasmid for β-catenin (set as 100%). Data are from two to three independent transfection experiments performed with each of the two mouse hepatocyte preparations. Data are expressed as means ± SD. P < 0.05, ∗∗P < 0.01, and ∗∗∗P < 0.001 versus the corresponding control for each reporter gene or HEV + control versus HEV-del TCF + control (t-test). Original magnification, ×50 (A). CBP, CREB-binding protein.
Figure 8
Figure 8
Differential glutamine synthetase (GS) expression and molecular features of deletion- versus point-mutant hepatoblastoma (HB) tumors. A: The heat map shows the scaled gene expression values for the 16 genes labeled at right in each tumor sample, including 102 human HB samples first analyzed by Cairo et al, and several mouse HB tumors from our laboratory: five ΔN90–β-catenin-YAP1, five S45Y–β-catenin-YAP1, and three S33Y–ΔN90-β-catenin-YAP1 tumors. All tumors are annotated by tumor category. Human tumors are classified as cluster 1 (C1) and cluster 2 (C2), as determined originally by Cairo et al. Unsupervised hierarchical clustering results are shown by the dendrogram at the top of the heat map. Most of the C1 human tumors cluster together, as do the C2 human tumors, thus correlating well with the original analysis. B: mRNA expression of Glul, encoding for GS, was determined by quantitative RT-PCR on whole liver lysates from all three HB tumor models and wild-type (WT) FVB mice for comparison. C: Representative images of immunohistochemistry staining for the pericentral enzyme cytochrome 2E1 in tumors from all three tumor models: ΔN90–β-catenin-YAP1, S45Y–β-catenin-YAP1, and S33Y–ΔN90-β-catenin-YAP1. Scale bars = 500 μm (C).

Similar articles

Cited by

References

    1. Czauderna P., Haeberle B., Hiyama E., Rangaswami A., Krailo M., Maibach R., Rinaldi E., Feng Y., Aronson D., Malogolowkin M., Yoshimura K., Leuschner I., Lopez-Terrada D., Hishiki T., Perilongo G., von Schweinitz D., Schmid I., Watanabe K., Derosa M., Meyers R. The Children's Hepatic tumors International Collaboration (CHIC): novel global rare tumor database yields new prognostic factors in hepatoblastoma and becomes a research model. Eur J Cancer. 2016;52:92–101. - PMC - PubMed
    1. Pappo A.S., Furman W.L., Schultz K.A., Ferrari A., Helman L., Krailo M.D. Rare tumors in children: progress through collaboration. J Clin Oncol. 2015;33:3047–3054. - PMC - PubMed
    1. Perilongo G., Malogolowkin M., Feusner J. Hepatoblastoma clinical research: lessons learned and future challenges. Pediatr Blood Cancer. 2012;59:818–821. - PubMed
    1. Czauderna P., Lopez-Terrada D., Hiyama E., Haberle B., Malogolowkin M.H., Meyers R.L. Hepatoblastoma state of the art: pathology, genetics, risk stratification, and chemotherapy. Curr Opin Pediatr. 2014;26:19–28. - PubMed
    1. Koch A., Denkhaus D., Albrecht S., Leuschner I., von Schweinitz D., Pietsch T. Childhood hepatoblastomas frequently carry a mutated degradation targeting box of the beta-catenin gene. Cancer Res. 1999;59:269–273. - PubMed

Publication types

MeSH terms