. 2019 Feb 21;20(4):934.
doi: 10.3390/ijms20040934.

Regulation of c-Raf Stability through the CTLH Complex

Affiliations

Regulation of c-Raf Stability through the CTLH Complex

Christina J McTavish et al. Int J Mol Sci. .

Abstract

c-Raf is a central component of the extracellular signal-regulated kinase (ERK) pathway which is implicated in the development of many cancer types. RanBPM (Ran-Binding Protein M) was previously shown to inhibit c-Raf expression, but how this is achieved remains unclear. RanBPM is part of a recently identified E3 ubiquitin ligase complex, the CTLH (C-terminal to LisH) complex. Here, we show that the CTLH complex regulates c-Raf expression through a control of its degradation. Several domains of RanBPM were found necessary to regulate c-Raf levels, but only the C-terminal CRA (CT11-RanBPM) domain showed direct interaction with c-Raf. c-Raf ubiquitination and degradation is promoted by the CTLH complex. Furthermore, A-Raf and B-Raf protein levels are also regulated by the CTLH complex, indicating a common regulation of Raf family members. Finally, depletion of CTLH subunits RMND5A (required for meiotic nuclear division 5A) and RanBPM resulted in enhanced proliferation and loss of RanBPM promoted tumour growth in a mouse model. This study uncovers a new mode of control of c-Raf expression through regulation of its degradation by the CTLH complex. These findings also uncover a novel target of the CTLH complex, and suggest that the CTLH complex has activities that suppress cell transformation and tumour formation.

Keywords: CTLH complex; ERK pathway; RMND5A; RanBPM; c-Raf; cancer; ubiquitination.


Conflict of interest statement

The authors declare no conflict of interest.

Figures

Figure 1
Figure 1
CTLH complex members RMND5A and RanBPM regulate c-Raf levels and cell proliferation. (A) RMND5A regulates endogenous c-Raf protein levels. Whole cell extracts from wild-type (WT) HEK293 cells and CRISPR KO RMND5A HEK293 cells untransfected (−) or transfected with pCGN-HA-RMND5A (+) were prepared and analyzed by Western blot. The top shows a representative analysis using c-Raf, HA (hemagglutinin), RMND5A, and β-actin antibodies to detect endogenous c-Raf, exogenous HA-RMND5A, endogenous RMND5A, and β-actin, respectively. Below, relative endogenous c-Raf protein levels were quantified by normalizing c-Raf to β-actin, and comparing values to wild-type HEK293 when set to a value of 1. Quantifications are shown with error bars indicating SD. p < 0.05 (*). (B) RMND5A regulates ERK signaling. Whole cell extracts from WT HEK293 cells and CRISPR KO RMND5A HEK293 cells were analyzed by Western blot for ERK and MEK phosphorylation. The same extracts were run on two different gels and equal loading was assessed for both analyses using total ERK and total MEK and a tubulin antibody. (C) RMND5A knockout HEK293 cells show increased proliferation. Growth rates for HEK293 control (WT, blue) and three different RMND5A CRISPR KO cell lines (clones #1, red, 3, green and 14, purple) were assessed for six days. Data represents average cell number from at least three experiments with error bars indicating SEM. p < 0.05 (*), p < 0.01 (**), p < 0.001 (***); (D) c-Raf expression is increased in primary RanBPM knockout mouse embryonic fibroblasts (MEFs). MEFs were isolated from RanBPM WT, and knockout (KO) embryos at D13.5. In the top, whole cell extracts were analyzed by Western blot with antibodies to RanBPM, c-Raf and β-actin. Below, quantification of relative amounts of c-Raf normalized to β-actin. Results are averaged from 13 paired MEFs samples from five different sets of embryos with error bars indicating SEM. p < 0.05 (*); (E) RanBPM knockout MEFs proliferate faster than WT MEFs. Growth rates for primary wildtype (WT, blue) and RanBPM knockout (KO, red) MEFs were assessed for five days. Data represents average cell number from three independent experiments performed in triplicate. Error bars represent SEM. p < 0.01 (**), p < 0.001 (***).
Figure 2
Figure 2
Downregulation of RanBPM promotes tumour formation in NOD/SCID/gamma mice. (A) re-expression of RanBPM in HEK293 cells via Tet-off pBIG expression vector. HEK293 pool of cells stably expressing RanBPM shRNA were transfected with pBIG-RanBPM WT (si-mt) and maintained in media with 2 μg/mL Tetracycline and 250 μg/mL hygromycin to select for integration of the pBIG vector. Following selection, cells were either maintained (+) in Tetracyclin-containing media, or cultured in absence of Tetracyclin (−) for 24 h to allow induction of RanBPM. Tetracyclin removal leads to re-expression of RanBPM (lane 4); (B) ERK pathway activation in RanBPM shRNA cells. Samples shown in (A) were analyzed for ERK phosphorylation and A-Raf and B-Raf expression. The Western blot was analyzed with the indicated antibodies; (C) injections with HEK293 control and RanBPM shRNA pools were injected subcutaneously in the flank of 6–8 weeks old NOD/SCID/gamma. Tumour measurements were taken twice per week and a digital caliper was used to measure Length × Width × Depth of the tumour upon excision in order to calculate volume. n = 7, error bars represent SEM; (D) injections with HEK293 RanBPM shRNA pool of cells stably re-expressing RanBPM via pBIG Tet-off expression system (see C, lanes 3,4). Mice were fed chow containing Dox (purple line) or regular chow (green line). n = 6, error bars represent SEM. p < 0.05 (*), p < 0.01 (**). Error bars are included for all data points but may not be visible when smaller than line size.
Figure 3
Figure 3
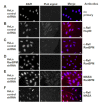
Endogenous RanBPM and c-Raf interaction in HeLa cells using PLA. Duolink II proximity ligation assay (PLA) was performed in: (A) control shRNA HeLa cells, without the addition of primary antibodies (negative control); (B) control shRNA HeLa cells, with Hsp90 and c-Raf primary antibodies (positive control); (C) control shRNA HeLa cells, using c-Raf and RanBPM primary antibodies; (D). HeLa RanBPM shRNA cells, with c-Raf and RanBPM primary antibodies (negative control); (E) control shRNA HeLa cells, using MAEA (Macrophage erythroblast attacher) and RanBPM primary antibodies (positive control). (F) Control shRNA HeLa cells, using c-Raf and MAEA primary antibodies. The DAPI filter was used to visualize the nuclei, while the Cyanine 3 (Cy3) filter was used to visualize the PLA dots representing protein–protein interactions. Representative images from one of three independent experiments are shown. Scale bars, 10 μm.
Figure 4
Figure 4
Analysis of RanBPM domains that control C-Raf stability. (A) schematic representation of RanBPM mutants. (B) and (C) Western blot analyses of HeLa RanBPM shRNA cells transfected with pEBG-GST-ΔN-c-Raf and either pCMV-HA (empty vector), pCMV-HA-WT-RanBPM or pCMV-HA RanBPM mutant constructs as indicated. c-Raf and HA antibodies were used to detect the levels of ΔN-c-Raf and RanBPM, respectively. β-actin was used as a loading control. A representative Western blot is shown (top) and quantifications of c-Raf levels are shown (bottom graph) with error bars indicating SEM (n = 5). Deletion of RanBPM C-terminal domain (ΔC1) impairs RanBPM interaction with GST-ΔN-c-Raf. (D) and (E) GST-Pull-down assays. HeLa RanBPM shRNA cells were transfected with pEBG-ΔN-c-Raf and either pCMV-HA (empty vector), pCMV-HA-WT-RanBPM or pCMV-HA RanBPM mutant constructs. ΔN-c-Raf was pulled down through binding to glutathione-sepharose beads and interaction of RanBPM WT and mutants with GST-ΔN-c-Raf assessed by Western blot with an HA antibody. Below: Quantifications were performed by normalizing RanBPM mutant levels to pulled-down GST or GST-ΔN-c-Raf and statistical analyses were performed (n = 4–7, SEM shown). Different letters are statistically different (p < 0.05).
Figure 5
Figure 5
RanBPM C-terminal CRA domain directly interacts with ΔN-c-Raf and is necessary for C-Raf regulation. (A) diagram of WT RanBPM, N2 domain and C1 domain cloned into the bacterial expression vector pGEX-4T-1; (B) Left, Western blot analysis of GST pull-down assays for N c-Raf performed using GST, GST-WT-RanBPM, GST-N2-domain and GST-C1-domain E. coli extracts. A representative image is shown. Right, pull down assays experiments were quantified by normalizing ΔN-c-Raf levels to pulled-down GST, GST-WT-RanBPM, GST-N2 or GST-C1 and statistical analyses were performed (n = 6, error bar indicates SEM) with different letters indicating statistical difference (p < 0.05); (C) analysis of RanBPM CRA mutants using in vitro pull-down. Right, schematic representation of the mutants analyzed. Left, Quantifications of pull down experiments performed with the CRA mutants as described in (B). Relative ∆N-C-Raf protein levels were quantified by normalizing ∆N-C-Raf to the GST-fusion protein product, and comparing values to GST when set to a value of 1. Quantifications are shown with error bars indicating SD (n = 3–5). Statistical difference with respect to GST-C4 is indicated, * p < 0.05; ** p < 0.01; (D) analysis of RanBPM CRA domain mutants in mammalian cells. HeLa RanBPM shRNA cells were transfected with pEBG-GST-ΔN-c-Raf and either pCMV-HA empty vector, RanBPM WT, RanBPM-ΔC4, RanBPM-ΔC1, or RanBPM-R625L E626L, and whole cell extracts were prepared 24 h post-transfection and analyzed by Western blot. HA, c-Raf and β-actin antibodies were used to detect HA-RanBPM constructs, ∆N-c-Raf and β-actin proteins, respectively. Right, relative ∆N-c-Raf protein levels were quantified by normalizing ∆N-c-Raf to β-actin, and comparing values to HA-WT when set to a value of 1. Different letters are statistically different (p < 0.05). Error bars indicate SD (n = 4).
Figure 6
Figure 6
C-Raf is regulated by the proteasome through the CTLH complex. Non-targeting shRNA control and shRNA RanBPM cells were treated with 10 μM MG132 or DMSO, as vehicle, for 24 h. RIPA buffered whole cell extracts of HeLa (A), and HCT116 (B) were analyzed by Western blot with RanBPM, c-Raf and β-actin antibodies to detect RanBPM, c-Raf and β-actin proteins, respectively. c-Raf protein levels were normalized to β-actin levels. Quantifications of relative c-Raf protein levels are shown with error bars indicating SD (n = 4). * p < 0.05; ** p < 0.01; ns, no significance. (C) c-Raf is ubiquitinated in a CTLH complex-dependent manner. Hela control (WT Hela) and RMND5A KO cells were transfected with GST-ΔN-c-Raf and/or HA-Ubiquitin as indicated. GST pull-downs performed using whole cell extracts were analyzed by Western blot with the indicated antibodies. Input represent 5% of the extracts used for pull-down. The asterix (*) indicates a non-specific band (NS). (D) A-Raf and B-Raf expression is increased in RMND5A KO cells. Extracts from HEK293 control and RMND5A CRISPR KO cells were analyzed by Western blot with the indicated antibodies. Quantifications are shown below with error bar indicating SD, n = 8 for A-Raf, **** p < 0.0001 and n = 3 for B-Raf, ** p < 0.01.
Figure 7
Figure 7
Model of regulation of c-Raf by the RanBPM/CTLH complex. Three RanBPM regions, N-terminal (1–102), LisH/CTLH (360–460) and C-terminal CRA (615–729) are necessary to regulate c-Raf expression/stability, but only the CRA domain is able to directly interact with c-Raf in vitro. Our data suggest that RanBPM interacts with c-Raf through the CRA domain and recruits c-Raf to the CTLH complex to which RanBPM is associated through its LisH/CTLH domain. The CTLH complex promotes c-Raf ubiquitination and degradation. The role of RanBPM N-terminal domain is unclear, but it may be involved in RanBPM stability and folding and potentially stabilizes c-Raf interaction (dashed line). The minimum region of c-Raf defined so far as necessary for interaction with RanBPM is ∆N-c-Raf, which is comprised of conserved region CR3 and short flanking sequences. The position of the CR1, CR2 and CR3 conserved regions are shown. The location of the c-Raf catalytic domain (KD, kinase domain) is indicated. The thick double-head arrow indicates interaction. The dashed arrow indicates a regulation of c-Raf by the RanBPM N-terminal domain. Ubiquitination of c-Raf by the CTLH complex is indicated by the pink arrow. The bracket indicates that the LiSH/CTLH domain mediates interaction with CTLH complex members.

Similar articles

Cited by

References

    1. Dhillon A.S., Hagan S., Rath O., Kolch W. MAP kinase signalling pathways in cancer. Oncogene. 2007;26:3279–3290. doi: 10.1038/sj.onc.1210421. - DOI - PubMed
    1. Matallanas D., Birtwistle M., Romano D., Zebisch A., Rauch J., von Kriegsheim A., Kolch W. Raf family kinases: Old dogs have learned new tricks. Genes Cancer. 2011;2:232–260. doi: 10.1177/1947601911407323. - DOI - PMC - PubMed
    1. Roskoski R., Jr. RAF protein-serine/threonine kinases: Structure and regulation. Biochem. Biophys. Res. Commun. 2010;399:313–317. doi: 10.1016/j.bbrc.2010.07.092. - DOI - PubMed
    1. Chong H., Lee J., Guan K.L. Positive and negative regulation of Raf kinase activity and function by phosphorylation. EMBO J. 2001;20:3716–3727. doi: 10.1093/emboj/20.14.3716. - DOI - PMC - PubMed
    1. Dhillon A.S., Meikle S., Yazici Z., Eulitz M., Kolch W. Regulation of Raf-1 activation and signalling by dephosphorylation. EMBO J. 2002;21:64–71. doi: 10.1093/emboj/21.1.64. - DOI - PMC - PubMed

Substances