

Insights into Body Size Evolution: A Comparative Transcriptome Study on Three Species of Asian Sisoridae Catfish
- PMID: 30795590
- PMCID: PMC6412271
- DOI: 10.3390/ijms20040944
Insights into Body Size Evolution: A Comparative Transcriptome Study on Three Species of Asian Sisoridae Catfish
Abstract
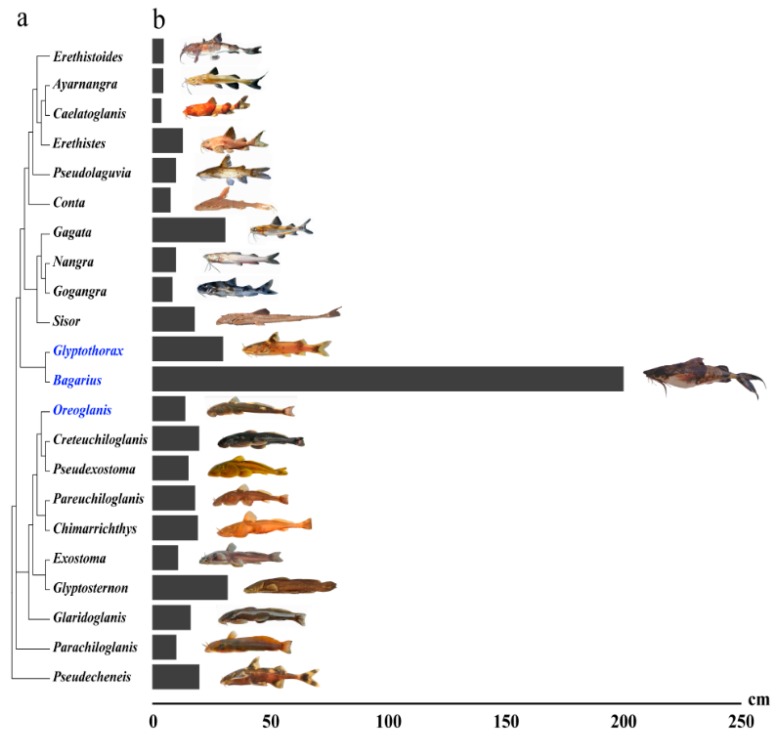
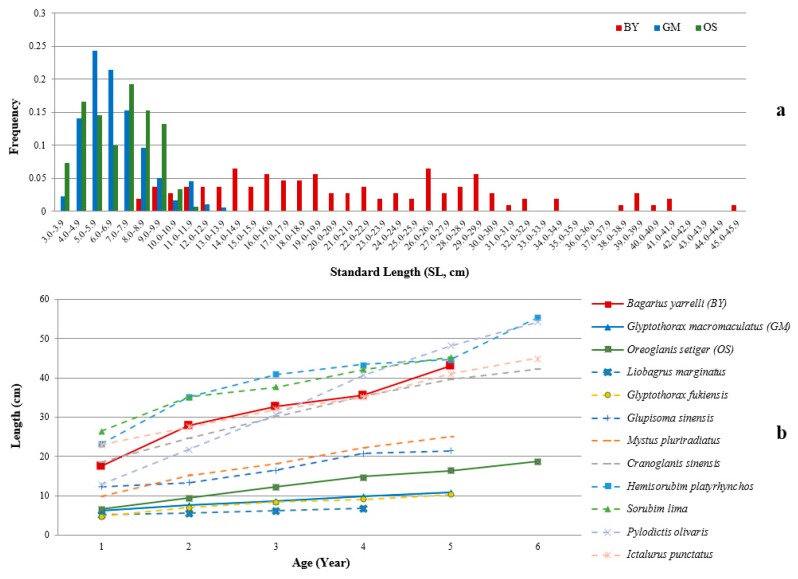
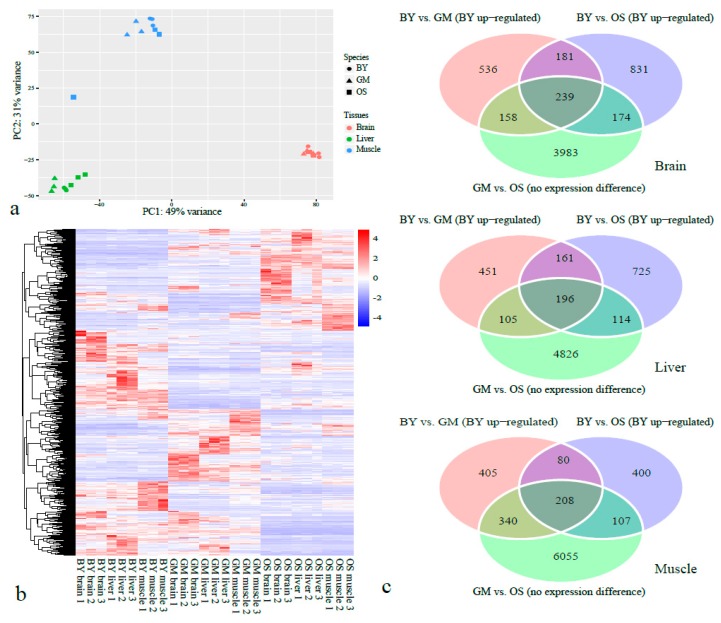
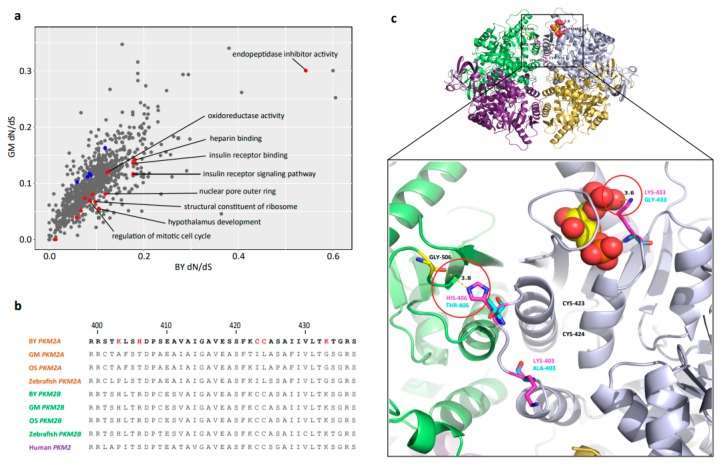
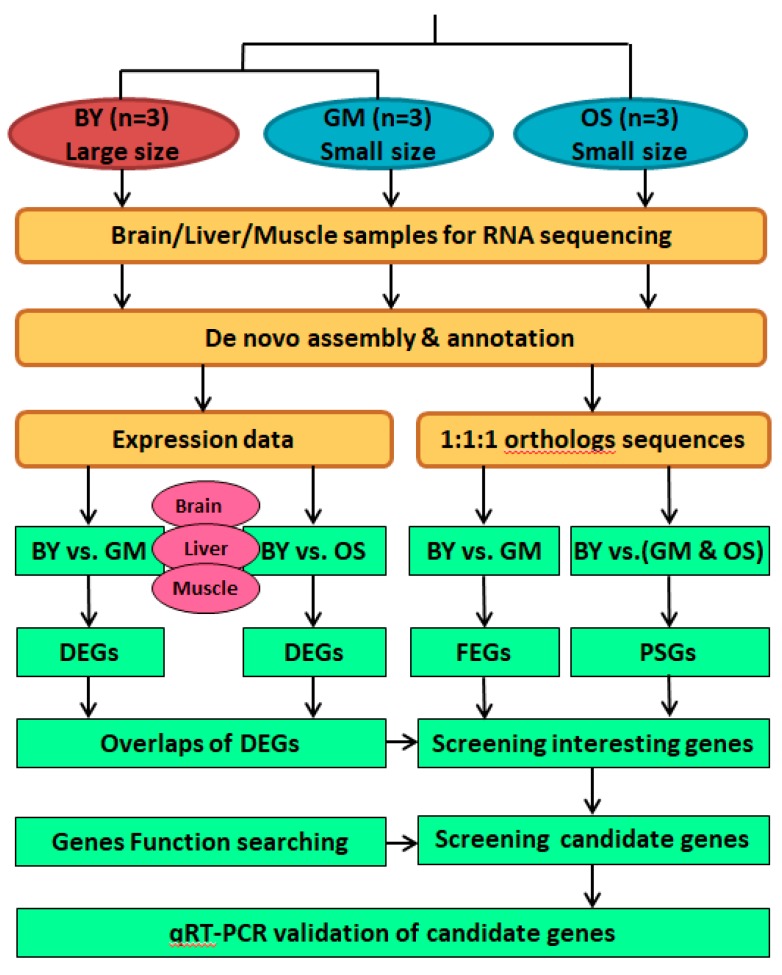
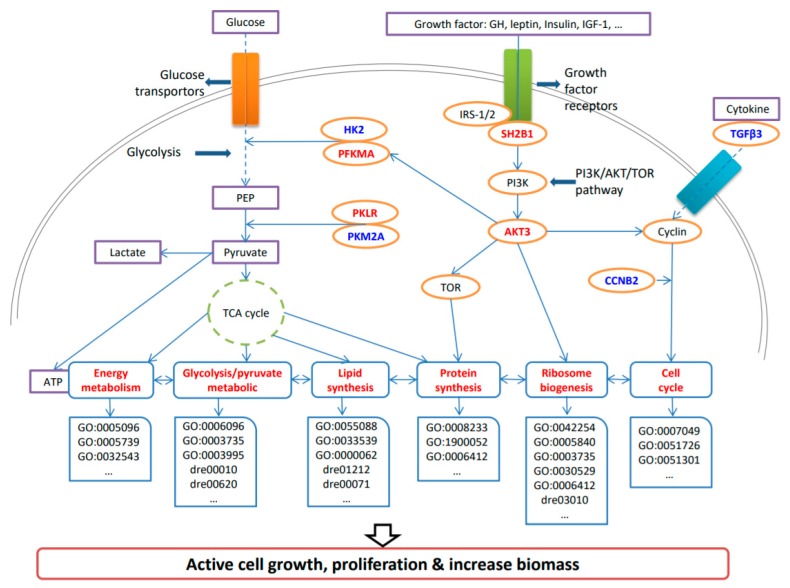
Body size is one of the most important attributes of a species, but the basic question of why and how each species reaches a different "right size" is still largely unknown. Herein, three phylogenetically closely related catfishes from Sisoridae, including one extraordinarily large-sized Bagarius yarrelli and two average-sized Glyptothorax macromaculatus and Oreoglanis setiger, were comparatively studied using RNA-Seq. Approximately 17,000 protein-coding genes were annotated for each of the three fishes, and 9509 genes were identified as high-confidence orthologous gene pairs. Comparative expressions uncovered a similar functional cluster about ribosome biogenesis was enriched in different tissues of the upregulated genes of Bagarius yarrelli. Moreover, differentially expressed genes and positively selected genes revealed that the glycolysis/pyruvate metabolism and cell cycle pathways have also greatly enhanced in this large-sized species. In total, 20 size-related candidate genes (including two growth modulators: the serine/threonine-protein kinases 3 (AKT3) and adaptor protein 1 (SH2B1), and a crucial pyruvate kinase (PKM2A)) were identified by multiplying comparative analyses along with gene functional screening, which would play major roles in enabling the large body size associated with Bagarius yarrelli and provide new insights into body size evolution. In conjunction with field observations and morphological comparisons, we hypothesize that habitat preferences promote size divergence of sisorids.
Keywords: Bagarius; body size; growth; pyruvate metabolic; ribosome.
Conflict of interest statement
The authors declare no conflict of interest.
Figures
Similar articles
-
Whole-Genome Sequencing of the Giant Devil Catfish, Bagarius yarrelli.Genome Biol Evol. 2019 Aug 1;11(8):2071-2077. doi: 10.1093/gbe/evz143. Genome Biol Evol. 2019. PMID: 31274158 Free PMC article.
-
De novo transcriptome analysis of Bagarius yarrelli (Siluriformes: Sisoridae) and the search for potential SSR markers using RNA-Seq.PLoS One. 2018 Feb 9;13(2):e0190343. doi: 10.1371/journal.pone.0190343. eCollection 2018. PLoS One. 2018. PMID: 29425202 Free PMC article.
-
Phylogenetic relationships and estimation of divergence times among Sisoridae catfishes.Sci China Life Sci. 2012 Apr;55(4):312-20. doi: 10.1007/s11427-012-4305-z. Epub 2012 May 9. Sci China Life Sci. 2012. PMID: 22566087
-
Monophyly and phylogenetic relationships of the catfish genus Glyptothorax (Teleostei: Sisoridae) inferred from nuclear and mitochondrial gene sequences.Mol Phylogenet Evol. 2011 Nov;61(2):278-89. doi: 10.1016/j.ympev.2011.06.018. Epub 2011 Jul 28. Mol Phylogenet Evol. 2011. PMID: 21820519
-
Comparative Transcriptome Analysis Reveals Differentially Expressed Genes and Signaling Pathways Between Male and Female Red-Tail Catfish (Mystus wyckioides).Mar Biotechnol (NY). 2019 Aug;21(4):463-474. doi: 10.1007/s10126-019-09894-x. Epub 2019 Apr 2. Mar Biotechnol (NY). 2019. PMID: 30941640
Cited by
-
Genetic mechanism of body size variation in groupers: Insights from phylotranscriptomics.Zool Res. 2024 Mar 18;45(2):314-328. doi: 10.24272/j.issn.2095-8137.2023.222. Zool Res. 2024. PMID: 38485502 Free PMC article.
-
The complete mitogenome of Amazonian Brachyplatystoma filamentosum and the evolutionary history of body size in the order Siluriformes.Sci Rep. 2025 Mar 21;15(1):9873. doi: 10.1038/s41598-025-94272-y. Sci Rep. 2025. PMID: 40119108 Free PMC article.
-
Whole-Genome Sequencing of the Giant Devil Catfish, Bagarius yarrelli.Genome Biol Evol. 2019 Aug 1;11(8):2071-2077. doi: 10.1093/gbe/evz143. Genome Biol Evol. 2019. PMID: 31274158 Free PMC article.
-
Comparative Transcriptome Profiling of the Loaches Triplophysa bleekeri and Triplophysa rosa Reveals Potential Mechanisms of Eye Degeneration.Front Genet. 2020 Jan 16;10:1334. doi: 10.3389/fgene.2019.01334. eCollection 2019. Front Genet. 2020. PMID: 32010191 Free PMC article.
-
Transcriptome mining extends the host range of the Flaviviridae to non-bilaterians.Virus Evol. 2022 Dec 26;9(1):veac124. doi: 10.1093/ve/veac124. eCollection 2023. Virus Evol. 2022. PMID: 36694816 Free PMC article.
References
-
- Haldane J.B.S. On being the right size. In: Shapely H., Raffort S., Wright H., editors. A Treasury of Science. Harper; New York, NY, USA: 1928. pp. 321–325.
-
- Feldman A., Sabath N., Pyron R.A., Mayrose I., Meiri S. Body sizes and diversification rates of lizards, snakes, amphisbaenians and the tuatara. Glob. Ecol. Biogeogr. 2016;25:187–197. doi: 10.1111/geb.12398. - DOI
MeSH terms
Substances
Grants and funding
LinkOut - more resources
Full Text Sources
Research Materials
