Review
. 2019 Feb 21;19(4):908.
doi: 10.3390/s19040908.

Contact-Based Methods for Measuring Respiratory Rate

Affiliations
Review

Contact-Based Methods for Measuring Respiratory Rate

Carlo Massaroni et al. Sensors (Basel). .

Abstract

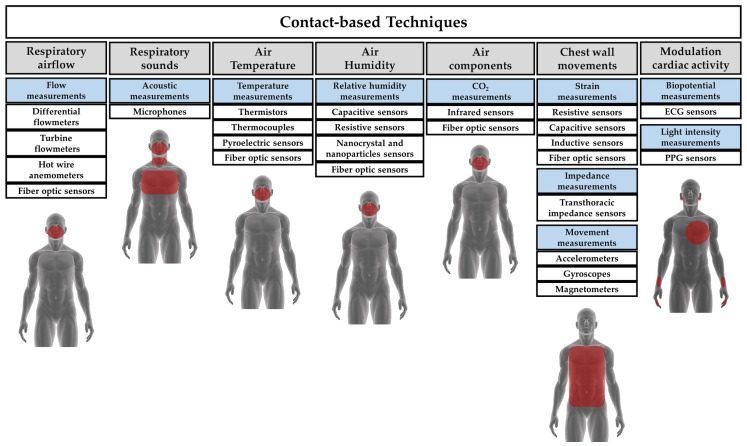
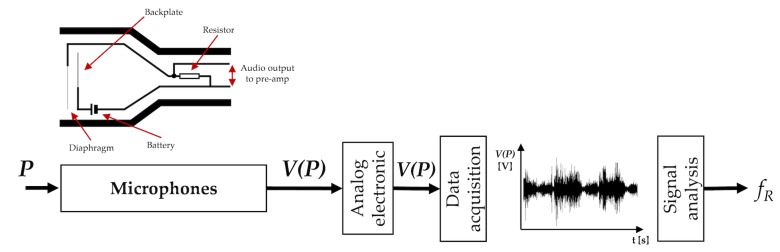
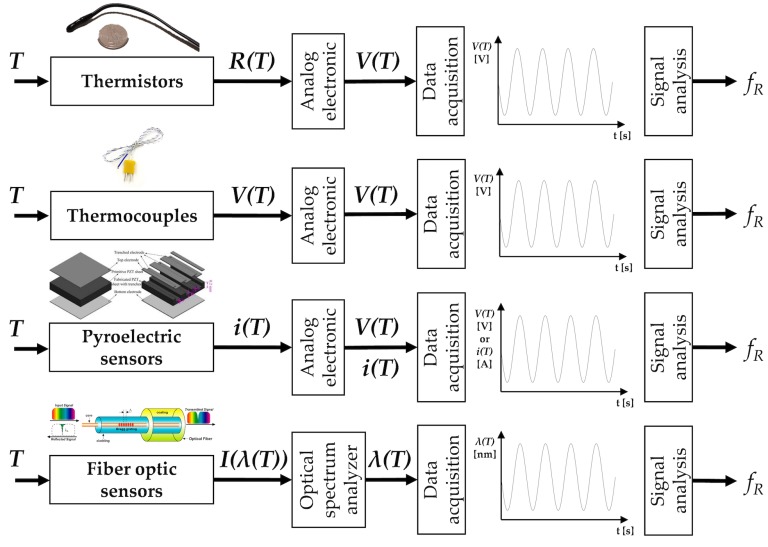
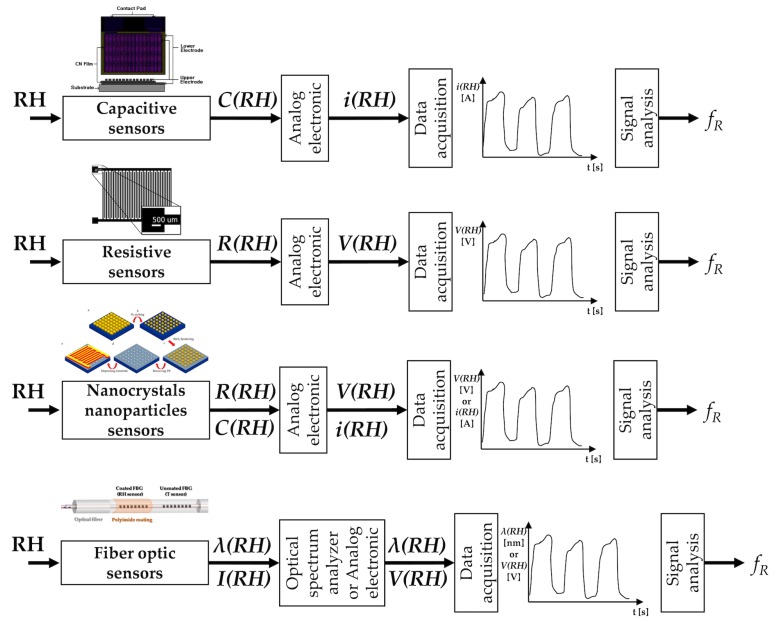
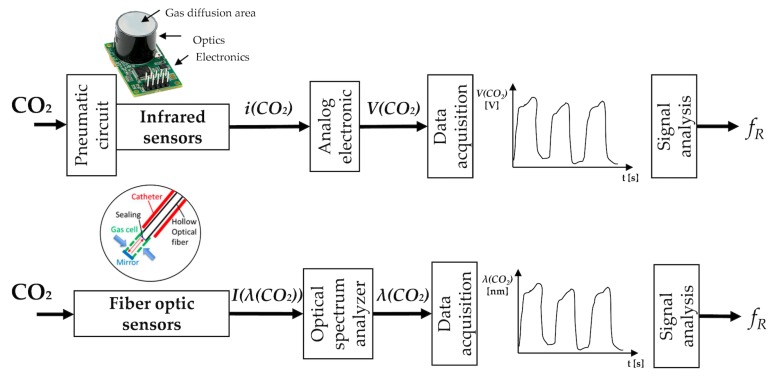
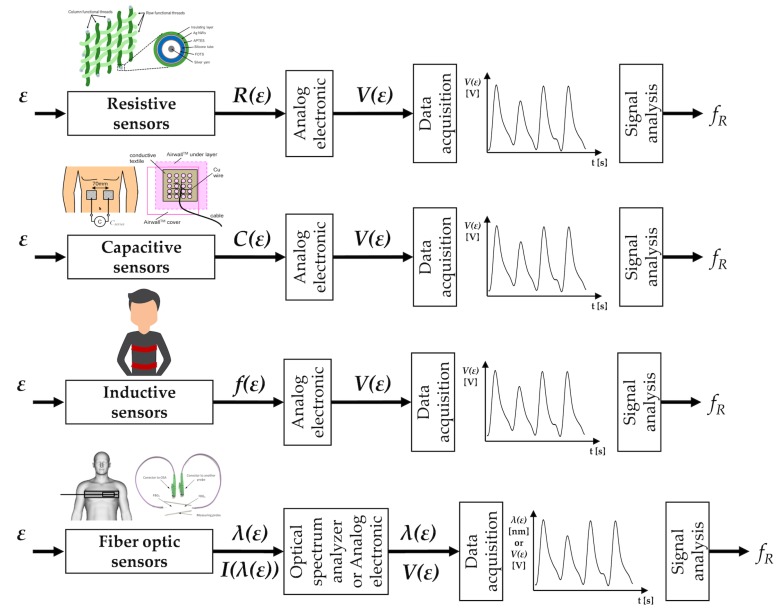
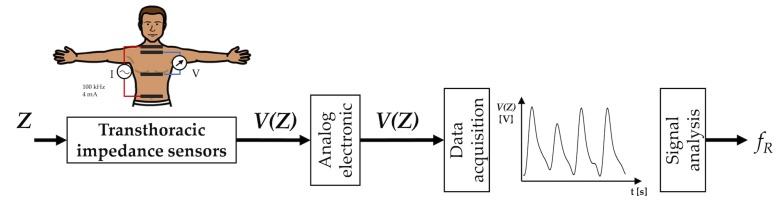
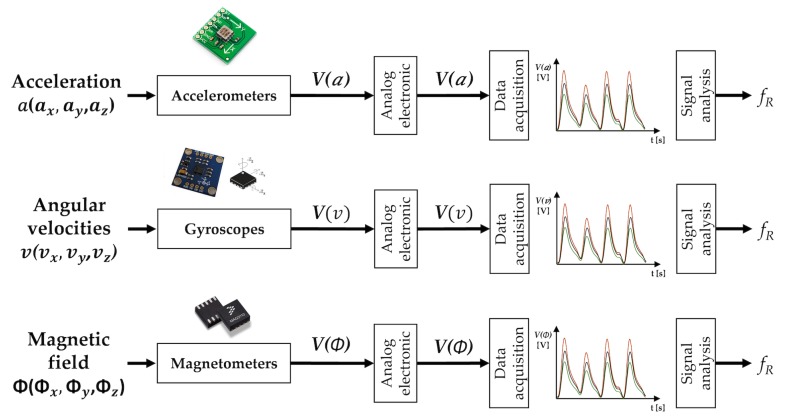
There is an ever-growing demand for measuring respiratory variables during a variety of applications, including monitoring in clinical and occupational settings, and during sporting activities and exercise. Special attention is devoted to the monitoring of respiratory rate because it is a vital sign, which responds to a variety of stressors. There are different methods for measuring respiratory rate, which can be classed as contact-based or contactless. The present paper provides an overview of the currently available contact-based methods for measuring respiratory rate. For these methods, the sensing element (or part of the instrument containing it) is attached to the subject's body. Methods based upon the recording of respiratory airflow, sounds, air temperature, air humidity, air components, chest wall movements, and modulation of the cardiac activity are presented. Working principles, metrological characteristics, and applications in the respiratory monitoring field are presented to explore potential development and applicability for each method.

Keywords: contact-based; measurement; respiratory frequency; sensors; wearable.


Conflict of interest statement

The authors declare no conflict of interest.

Figures

Figure 1
Figure 1
Most popular contact-based techniques for measuring fR and related areas of the body on which the sensors must be positioned. PPG = photoplethysmography; ECG = Electrocardiography.
Figure 2
Figure 2
Airflow sensors: the main elements composing the measuring chain (sensor, analog electronics, data acquisition, post-processing or signal analysis stage) to estimate fR. Analog electronic stages vary between different flowmeters because the output quantities are different. ΔP(Q), nrev(Q), i(Q), R(Q), λ(Q), I(Q) are pressure drop, turbine revolutions per minute, current, resistance, wavelength, and light intensity changes caused by the airflow (Q), respectively. V(Q) is the voltage output. The DF figure is from Sensirion [33]; the turbine flowmeter figure is from MIR [34]; the HWA figure is from [35].
Figure 3
Figure 3
Acoustic sensors: the main elements composing the measuring chain (sensor, analog electronics, data acquisition, post-processing or signal analysis stage) to estimate fR. P is the acoustical pressure; V(P) is the voltage output. The acoustic sensor scheme is adapted from [74].
Figure 4
Figure 4
Temperature sensors: the main elements composing the measuring chain (sensor, analog electronics, data acquisition, post-processing or signal analysis stage) to estimate fR. Analog electronic stages vary between different sensors since the output quantities are different. R(T), V(T), i(T), I(λ(T)) are resistance, voltage, current and light intensity changes caused by the temperature (T), respectively. V(T) is the voltage output. The pyroelectric sensor figure is adapted from [88]; the fiber-optic sensor figure is adapted from [89].
Figure 5
Figure 5
Relative humidity sensors: main elements composing the measuring chain (sensor, analog electronics, data acquisition, post-processing or signal analysis stage) to estimate fR. Analog electronic stages vary between different sensors since the output quantities are different. C(RH), R(RH), λ(RH), I(RH) are capacitance, resistance, wavelength, and light intensity changes caused by the RH, respectively. V(RH) is the voltage output, i(RH) is the current output. The capacitive sensors picture is adapted from [112]; the resistive sensors picture is from [113]; the nanocrystals and nanoparticles sensors image is from [114]; the fiber-optic humidity sensors picture is adapted from [115].
Figure 6
Figure 6
CO2 sensors: the main elements composing the measuring chain (sensor, analog electronics, data acquisition, post-processing or signal analysis stage) to estimate fR. Analog electronic stages vary between different sensors since the output quantities are different. i(CO2), I(λ(CO2)) are current and light intensity changes caused by the CO2, respectively. V(CO2) is the voltage output. The scheme of fiber-optic sensors is adapted from [148].
Figure 7
Figure 7
Strain sensors: the main elements composing the measuring chain (sensor, analog electronics, data acquisition, post-processing or signal analysis stage) to estimate fR. Analog electronic stages vary between different sensors since the output quantities are different. R(ϵ), C(ϵ), f(ϵ), λ(ϵ), I(λ(ϵ)) are resistance, capacitance, frequency peak, wavelength and light intensity changes caused by the strain (ϵ), respectively. V(ϵ) is the voltage output. The resistive sensors picture is from [158]; the capacitive sensor picture is adapted from [159]; the fiber-optic sensors picture is adapted from [160].
Figure 8
Figure 8
Impedance sensors: the main elements composing the measuring chain (sensor, analog electronics, data acquisition, post-processing or signal analysis stage) to estimate fR. V(Z) is the voltage output caused by impedance (Z) changes.
Figure 9
Figure 9
Movement sensors: the main elements composing the measuring chain (sensor, analog electronics, data acquisition, post-processing or signal analysis stage) to estimate fR. The output quantities are different among sensors. (ax,ay,az), (vx,vy,vz), and (Φx,Φy,Φz) are three-axis accelerations, three-axis angular velocities, and three-axis magnetic field outputs changes caused by the acceleration (a), angular velocity (v) and magnetic field (Φ) changes, respectively. V(.) is the voltage output.
Figure 10
Figure 10
Sensors for recording breathing modulatory effect on cardiac activity: the main elements composing the measuring chain (sensor, analog electronics, data acquisition, post-processing or signal analysis stage) to estimate fR. Analog electronic stages vary between different sensors since the output quantities are different. I(λ), V(V1,2,3,,n) are light intensity and biopotential signals (number 1,2,3,,n depends on the number of ECG channels), respectively. V(.) is the voltage output. The PPG sensor picture is from [233].

References

    1. Nicolò A., Girardi M., Sacchetti M. Control of the depth and rate of breathing: Metabolic vs. non-metabolic inputs. J. Physiol. 2017;595:6363–6364. doi: 10.1113/JP275013. - DOI - PMC - PubMed
    1. Nicolò A., Girardi M., Bazzucchi I., Felici F., Sacchetti M. Respiratory frequency and tidal volume during exercise: Differential control and unbalanced interdependence. Physiol. Rep. 2018;6:e13908. doi: 10.14814/phy2.13908. - DOI - PMC - PubMed
    1. Tipton M.J., Harper A., Paton J.F., Costello J.T. The human ventilatory response to stress: Rate or depth? J. Physiol. 2017;595:5729–5752. doi: 10.1113/JP274596. - DOI - PMC - PubMed
    1. Cretikos M.A., Bellomo R., Hillman K., Chen J., Finfer S., Flabouris A. Respiratory rate: The neglected vital sign. Med. J. Aust. 2008 doi: 10.5694/j.1326-5377.2008.tb01825.x. - DOI - PubMed
    1. Lovett P.B., Buchwald J.M., Stürmann K., Bijur P. The vexatious vital: Neither clinical measurements by nurses nor an electronic monitor provides accurate measurements of respiratory rate in triage. Ann. Emerg. Med. 2005;45:68–76. doi: 10.1016/j.annemergmed.2004.06.016. - DOI - PubMed

LinkOut - more resources