. 2019 Feb 21;11(2):251.
doi: 10.3390/cancers11020251.

Pan-Cancer Analyses Reveal Genomic Features of FOXM1 Overexpression in Cancer

Affiliations

Pan-Cancer Analyses Reveal Genomic Features of FOXM1 Overexpression in Cancer

Carter J Barger et al. Cancers (Basel). .

Abstract

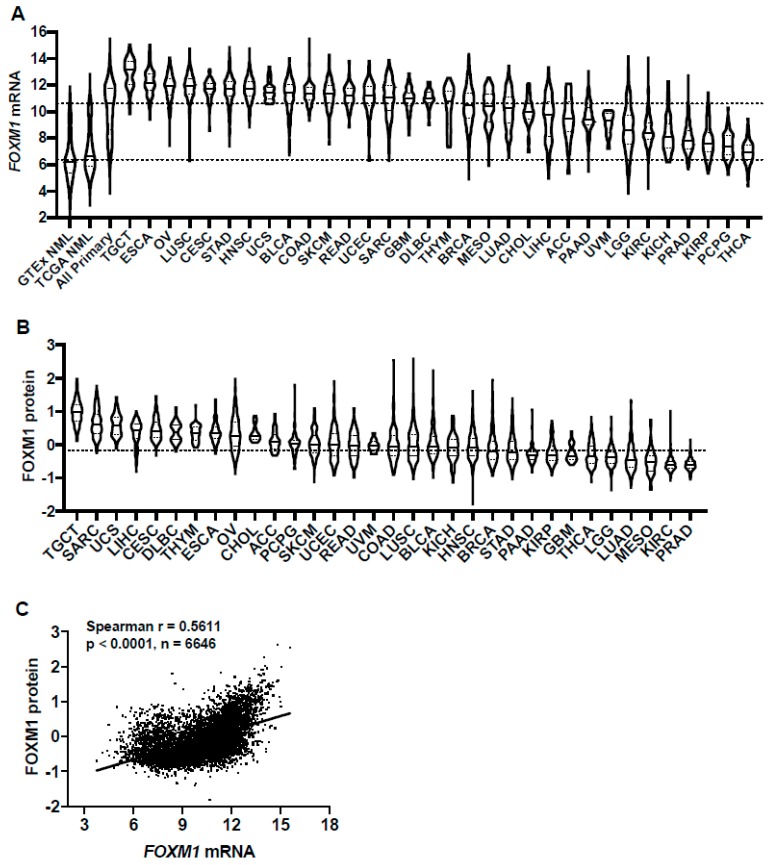
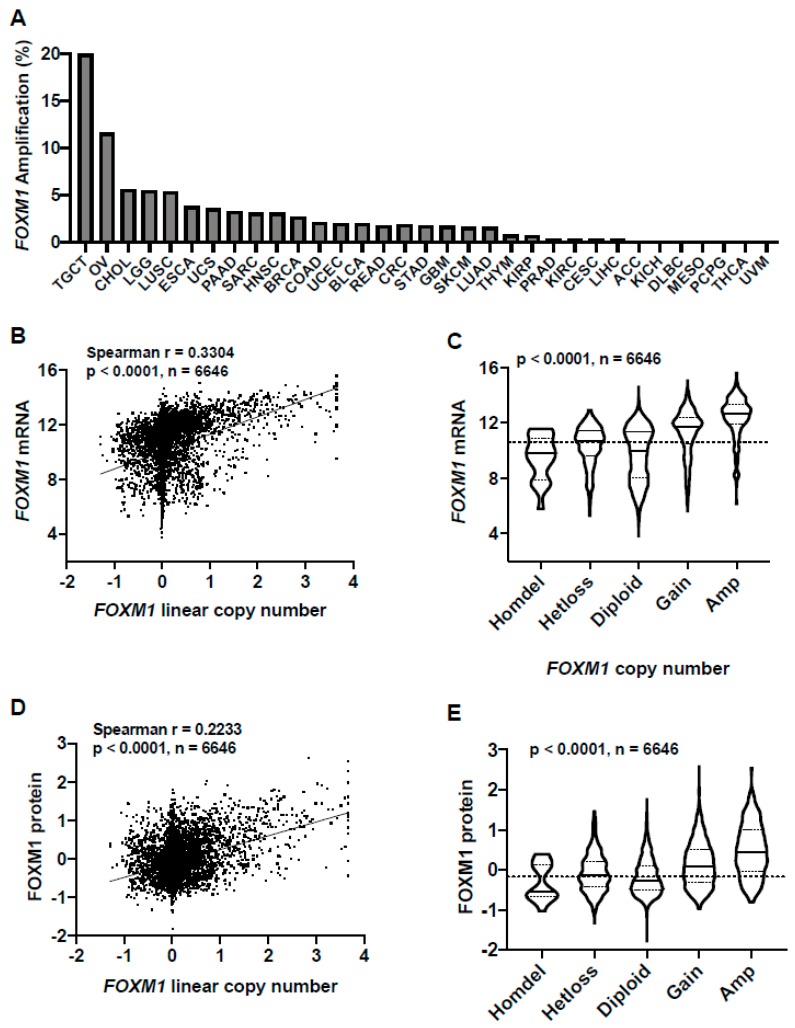
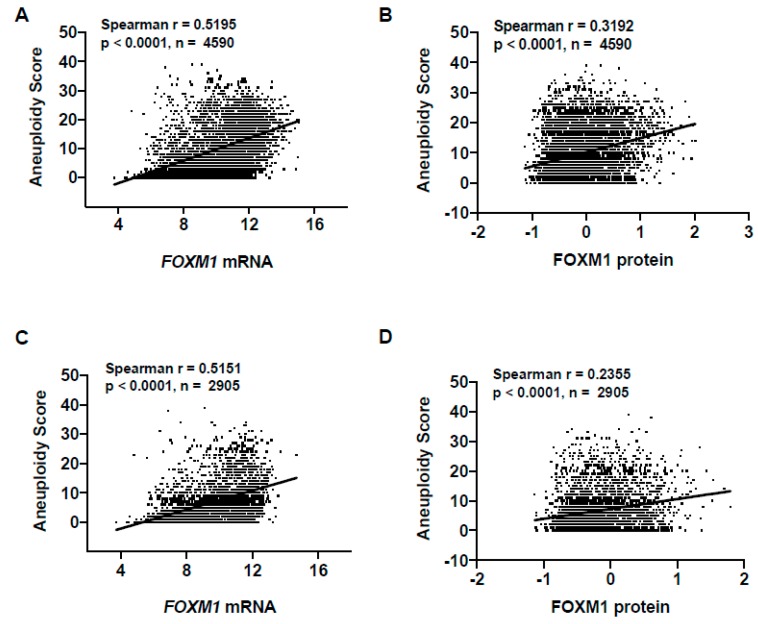
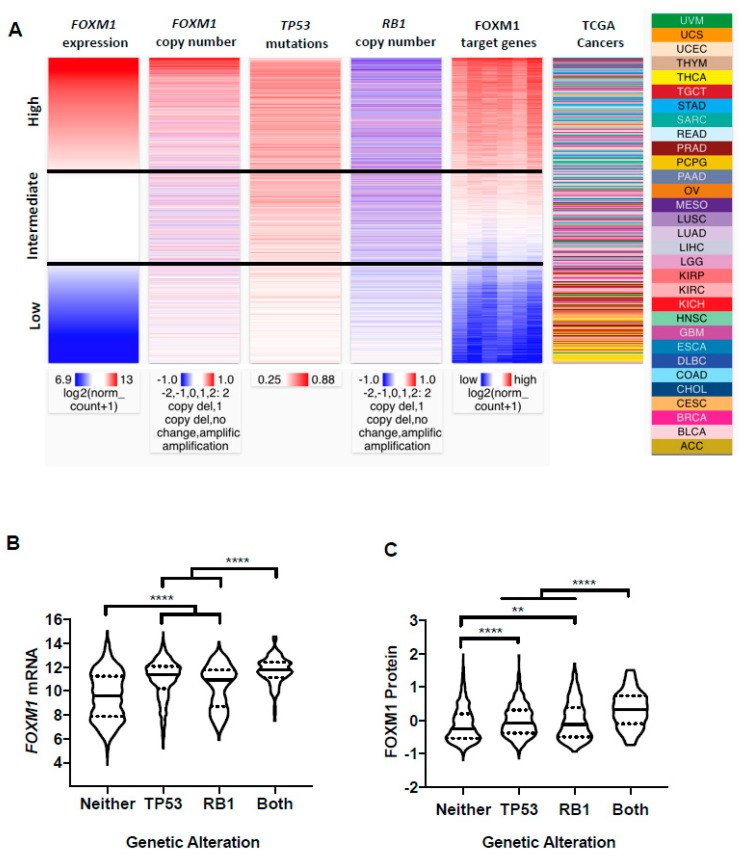
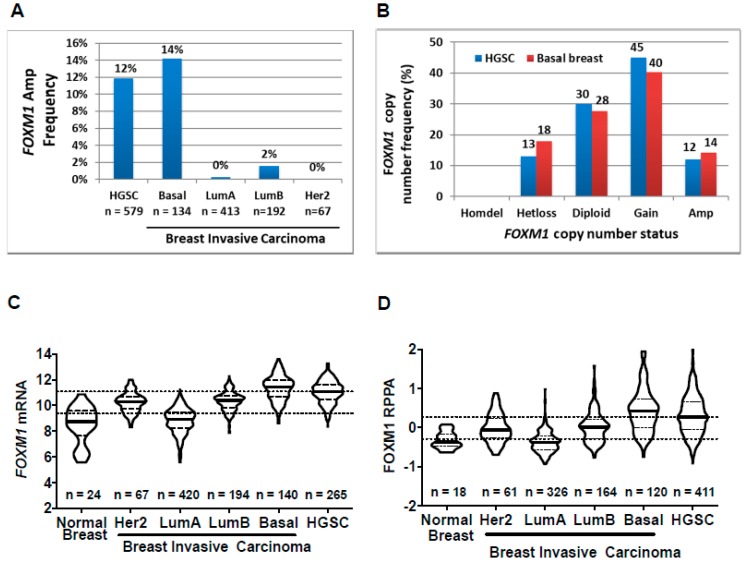
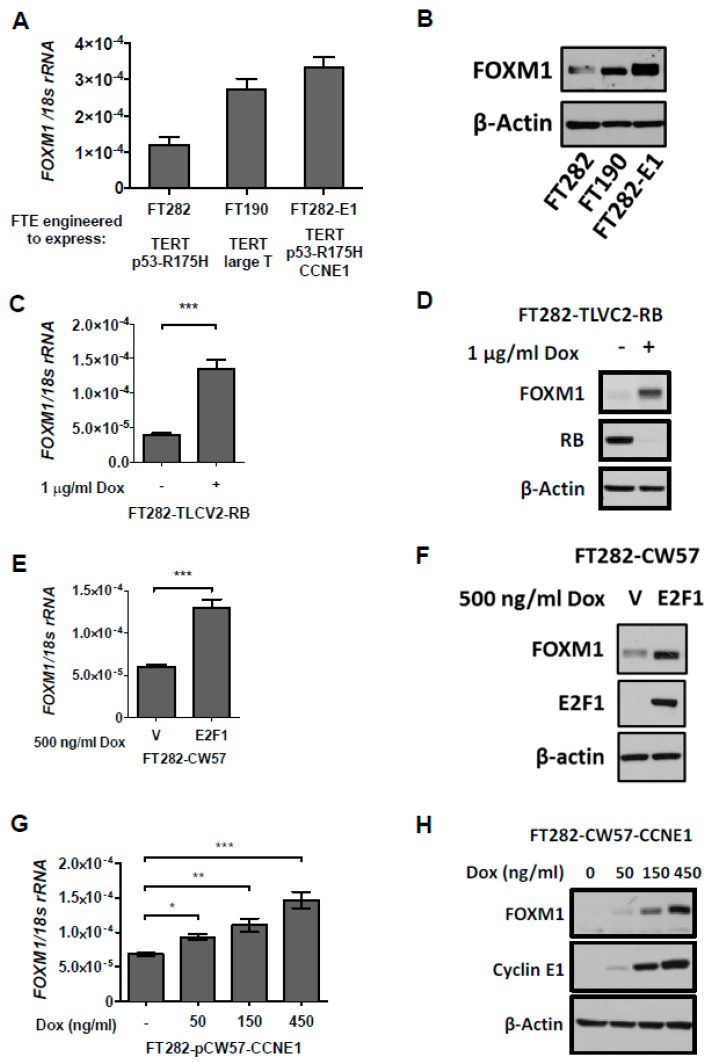
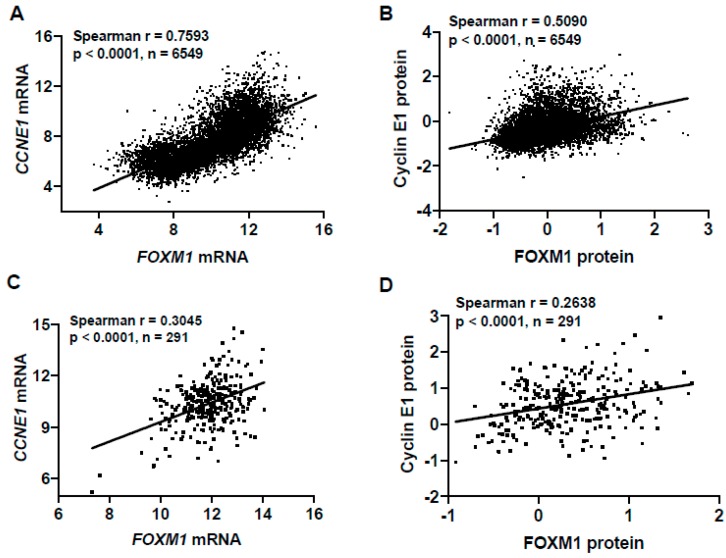
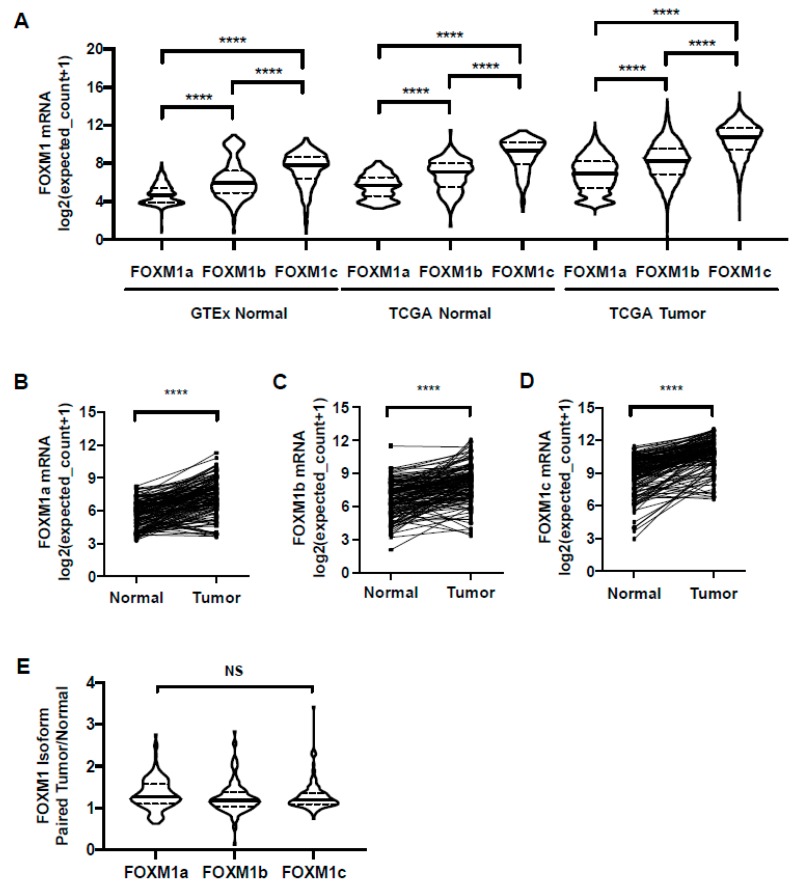
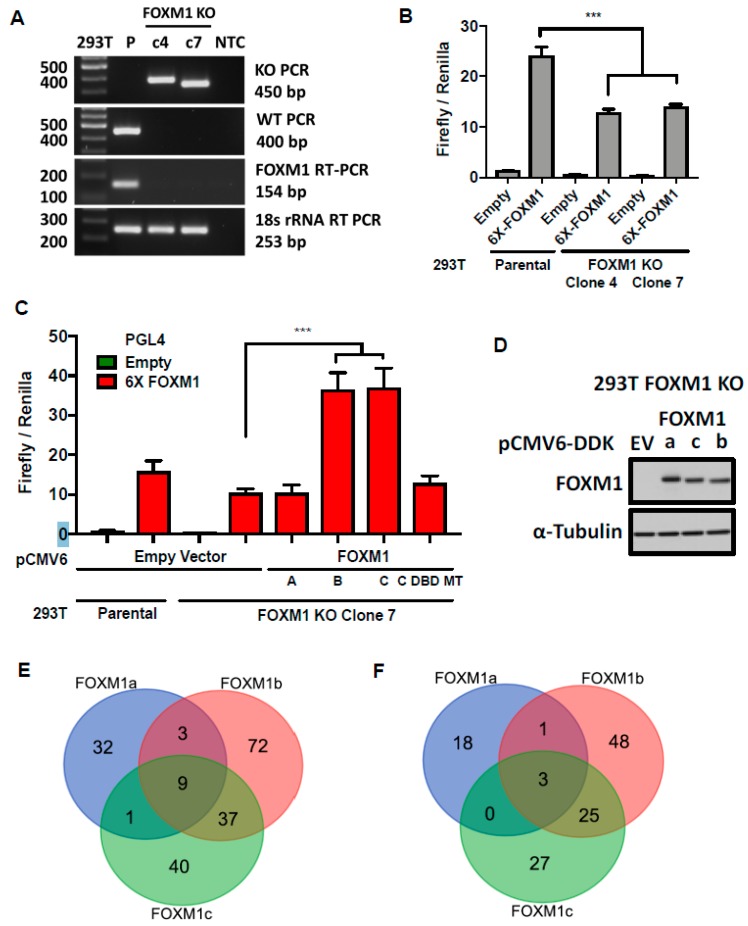
FOXM1 is frequently overexpressed in cancer, but this has not been studied in a comprehensive manner. We utilized genotype-tissue expression (GTEx) normal and The Cancer Genome Atlas (TCGA) tumor data to define FOXM1 expression, including its isoforms, and to determine the genetic alterations that promote FOXM1 expression in cancer. Additionally, we used human fallopian tube epithelial (FTE) cells to dissect the role of Retinoblastoma (Rb)-E2F and Cyclin E1 in FOXM1 regulation, and a novel human embryonic kidney cell (HEK293T) CRISPR FOXM1 knockout model to define isoform-specific transcriptional programs. FOXM1 expression, at the mRNA and protein level, was significantly elevated in tumors with FOXM1 amplification, p53 inactivation, and Rb-E2F deregulation. FOXM1 expression was remarkably high in testicular germ cell tumors (TGCT), high-grade serous ovarian cancer (HGSC), and basal breast cancer (BBC). FOXM1 expression in cancer was associated with genomic instability, as measured using aneuploidy signatures. FTE models confirmed a role for Rb-E2F signaling in FOXM1 regulation and in particular identified Cyclin E1 as a novel inducer of FOXM1 expression. Among the three FOXM1 isoforms, FOXM1c showed the highest expression in normal and tumor tissues and cancer cell lines. The CRISPR knockout model demonstrated that FOXM1b and FOXM1c are transcriptionally active, while FOXM1a is not. Finally, we were unable to confirm the existence of a FOXM1 auto-regulatory loop. This study provides significant and novel information regarding the frequency, causes, and consequences of elevated FOXM1 expression in human cancer.

Keywords: FOXM1; Retinoblastoma protein Cyclin E1; basal breast cancer; fallopian tube epithelial cells; gene amplification; genomic instability; high-grade serous ovarian cancer; pan-cancer; testicular germ cell tumors.


Conflict of interest statement

The authors declare there are no conflicts of interest.

Figures

Figure 1
Figure 1
FOXM1 mRNA and protein expression in genotype-tissue expression (GTEx) normal, The Cancer Genome Atlas (TCGA) normal, and TCGA cancer tissues. (A) FOXM1 mRNA expression (RNA-seq RSEM, log2(norm count +1)) in GTEx and TCGA datasets. Sample lines represent medians and quartiles. Low and high dotted lines across the graph represent median expression for GTEx and TCGA normal, and TCGA cancer, respectively. Cancer types consist of primary tumors only and are ranked by median FOXM1 mRNA expression. The key to all TCGA abbreviations is shown in Table S1. (B) FOXM1 protein expression (Reverse Phase Protein Array; RPPA, pan-can normalized) across TCGA cancer types. (C) FOXM1 mRNA expression (RNA Seq V2 RSEM, log2(norm count +1) correlations with FOXM1 protein expression (RPPA, pan-cancer normalized)) across TCGA cancer types.
Figure 2
Figure 2
FOXM1 amplifications in TCGA pan-cancer and correlations with FOXM1 mRNA and protein expression. (A) FOXM1 amplification frequency in TCGA cancer types as determined by GISTIC. Cancer types are ranked by FOXM1 amplification frequency. (B) FOXM1 mRNA expression (RNA-seq RSEM, log2(norm count +1)) compared to FOXM1 linear copy number values across all TCGA cancer types. (C) FOXM1 mRNA expression (RNA-seq RSEM, log2(norm count +1)) compared to FOXM1 copy number (GISTIC) across all TCGA cancer types. The p value for analysis of variance (ANOVA) with post-test for linear trend is shown. Sample lines represent medians and quartiles. The dotted line across the graph represents the median expression for all TCGA primary tumors. (D) FOXM1 protein expression (RPPA) correlated with FOXM1 linear copy number values across all TCGA cancer types. (E) FOXM1 protein expression (RPPA) compared to FOXM1 copy number across all TCGA cancer types. The p value for ANOVA with post-test for linear trend is shown. Sample lines represent medians and quartiles. The dotted line across the graph represents median expression for all TCGA primary tumors.
Figure 3
Figure 3
Association of FOXM1 expression with aneuploidy in TCGA pan-cancer. (A) FOXM1 mRNA expression (RNA-seq RSEM, log2(norm count +1)) correlations with tumor aneuploidy scores in TCGA primary tumors. (B) FOXM1 protein expression (RPPA, pan-can normalized) correlation with tumor aneuploidy score in TCGA primary tumors. (C) FOXM1 mRNA expression (RNA-seq RSEM, log2(norm count +1)) correlation with tumor aneuploidy score in FOXM1 diploid TCGA primary tumors. (D) FOXM1 protein expression (RPPA, pan-can normalized) correlations with tumor aneuploidy scores in FOXM1 diploid TCGA primary tumors.
Figure 4
Figure 4
FOXM1 expression in TCGA cancer types by p53/Rb status. (A) Comparison of FOXM1 mRNA expression, FOXM1 copy number, TP53 somatic mutations, RB1 copy number, and FOXM1 target genes among all TCGA primary tumors with overlapping genomics data. Data were retrieved from UCSC Xena. FOXM1 target genes included AURKB, CCNA2, CCNB1, CCNB2 and CENPA. (B,C) FOXM1 expression in tumors with T53 somatic mutations and RB1 copy number loss. (B) FOXM1 mRNA expression (RNA-seq RSEM, log2(norm count +1)) in tumors with T53 somatic mutations (n = 1288), RB1 copy number loss or somatic mutation (n = 190), both alterations (n = 128) or neither alteration (n = 3362). (C) FOXM1 protein expression (RPPA pan-can normalized) in tumors with T53 somatic mutations (n = 1288), RB1 copy number loss or somatic mutation (n = 190), both alterations (n = 128), or neither alteration (n = 3362). Mann-Whitney test p values are shown. p value designations: **** < 0.0001, ** < 0.01,
Figure 5
Figure 5
FOXM1 copy number alterations (CNA) and expression in TCGA OV (HGSC) vs. BRCA (Breast) molecular (PAM50) subtypes. (A) FOXM1 amplification frequency in HGSC vs. breast molecular subtypes. (B) FOXM1 copy number status in HGSC vs. basal breast. (C,D) FOXM1 expression in HGSC vs breast molecular subtypes (C) mRNA expression (RNA-seq) and (D) protein expression (RPPA, pan-can normalized). Lines represent group medians. Low and high dotted lines across the graph represent median expression for Her2, LumA and LumB breast molecular subtypes, and HGSC, respectively.
Figure 6
Figure 6
FOXM1 expression in fallopian tube epithelial (FTE) cells engineered for deregulation of the Rb-E2F pathway. (A,B) FOXM1 mRNA and protein expression were measured by RT-qPCR and Western blot, respectively, in the indicated FTE cell lines. β-actin is shown as a loading control. (C,D) FOXM1 expression by RT-qPCR and Western blot, respectively, in RB1 CRISPR KO FT282 cells. (E,F) FOXM1 expression by RT-qPCR and Western blot, respectively, in E2F1 inducible FTE cells. (G,H) FOXM1 expression by RT-qPCR and Western blot, respectively, in CCNE1 inducible FTE cells. Bars represent mean ± SD. Student’s t test p values are shown. p value designations: *** < 0.001, ** < 0.01, * < 0.05.
Figure 7
Figure 7
FOXM1 and CCNE1 expression correlation in pan-cancer and high-grade serous ovarian cancer (HGSC) tissues. (A) Correlation of FOXM1 expression and CCNE1 mRNA expression (RNA-seq RSEM, log2(norm count +1)) in TCGA pan-cancer tissues. (B) Correlation of FOXM1 expression and CCNE1 protein expression ((RPPA, pan-can normalized) in TCGA pan-cancer tissues. (C) Correlation of FOXM1 expression and CCNE1 mRNA expression (RNA-seq RSEM, log2(norm count +1)) in TCGA HGSC tissues. (D) Correlation of FOXM1 expression and CCNE1 protein expression (RPPA, pan-can normalized) in TCGA HGSC tissues.
Figure 8
Figure 8
FOXM1 isoform expression in GTEx normal, TCGA normal, and TCGA cancer tissues. (A) FOXM1 isoform expression (RNA-seq RSEM, log2(norm count +1)) in GTEx (n = 843) and TCGA normal (n = 175) and cancer tissues (n = 6309). (BE) FOXM1 isoform expression (RNA-seq RSEM, log2(norm count +1)) in TCGA paired normal and tumor tissues (n = 135). (B) FOXM1a mRNA expression (RNA-seq RSEM, log2(norm count +1)). (C) FOXM1b mRNA expression (RNA-seq RSEM, log2(norm count +1). (D) FOXM1c mRNA expression (RNA-seq RSEM, log2(norm count +1)). (E) FOXM1 isoform mRNA expression (RNA-seq RSEM, log2(norm count+1)) ratio between paired tumor and normal tissue (n = 135).
Figure 9
Figure 9
FOXM1 isoform transcriptional activity in HEK293T (293T) FOXM1 knockout cells. (A) PCR genotype of two FOXM1 CRISPR knockout clones. (B) 6X-FOXM1 reporter assay in 293T FOXM1 knockout clones. (CF) 293T FOXM1 knockout clone 7 transiently reconstituted with FOXM1 isoforms a, b and c. (C) 6X-FOXM1 reporter assay. (D) FOXM1 Western blot related to RNA-seq. (EF) Venn diagrams of gene transcripts showing significant changes in expression for each FOXM1 isoform. (E) Overlap of gene transcripts showing those with both significant increases and decreases (FDR < 0.05) in expression. (F) Overlap of transcriptional targets showing only those with significant (FDR < 0.05) increases in expression. Bars represent mean ± SD. Student’s t test p values are shown. p value designations: *** < 0.001.

Similar articles

Cited by

References

    1. Ye H., Kelly T.F., Samadani U., Lim L., Rubio S., Overdier D.G., Roebuck K.A., Costa R.H. Hepatocyte nuclear factor 3/fork head homolog 11 is expressed in proliferating epithelial and mesenchymal cells of embryonic and adult tissues. Mol. Cell. Biol. 1997;17:1626–1641. doi: 10.1128/MCB.17.3.1626. - DOI - PMC - PubMed
    1. Costa R.H. FoxM1 dances with mitosis. Nat. Cell Biol. 2005;7:108–110. doi: 10.1038/ncb0205-108. - DOI - PubMed
    1. Laoukili J., Kooistra M.R., Bras A., Kauw J., Kerkhoven R.M., Morrison A., Clevers H., Medema R.H. FoxM1 is required for execution of the mitotic programme and chromosome stability. Nat. Cell Biol. 2005;7:126–136. doi: 10.1038/ncb1217. - DOI - PubMed
    1. Wonsey D.R., Follettie M.T. Loss of the forkhead transcription factor FoxM1 causes centrosome amplification and mitotic catastrophe. Cancer Res. 2005;65:5181–5189. doi: 10.1158/0008-5472.CAN-04-4059. - DOI - PubMed
    1. Cancer Genome Atlas Research N. Integrated genomic analyses of ovarian carcinoma. Nature. 2011;474:609–615. doi: 10.1038/nature10166. - DOI - PMC - PubMed