. 2019 Feb 21;12(4):657.
doi: 10.3390/ma12040657.

Rheological Property Criteria for Buildable 3D Printing Concrete

Affiliations

Rheological Property Criteria for Buildable 3D Printing Concrete

Hoseong Jeong et al. Materials (Basel). .

Abstract

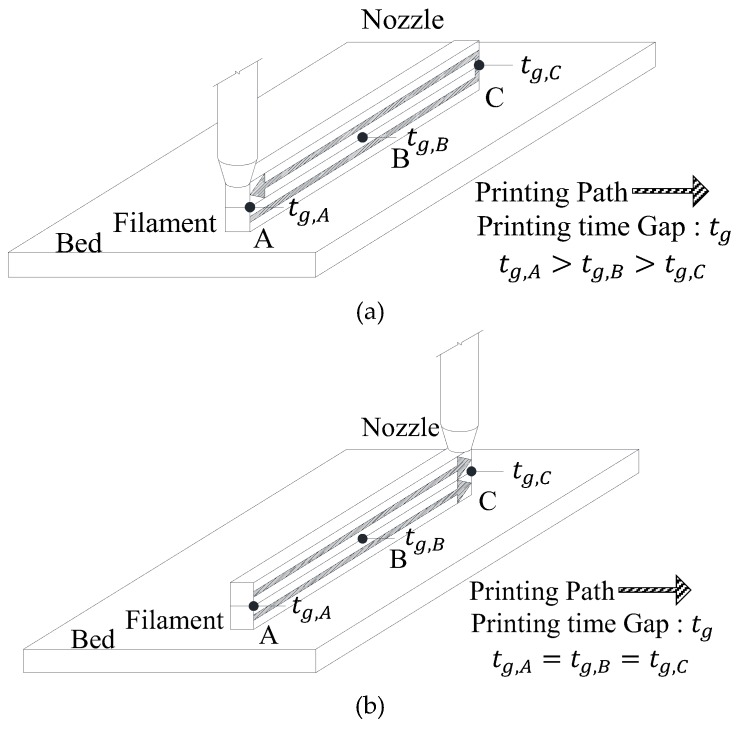
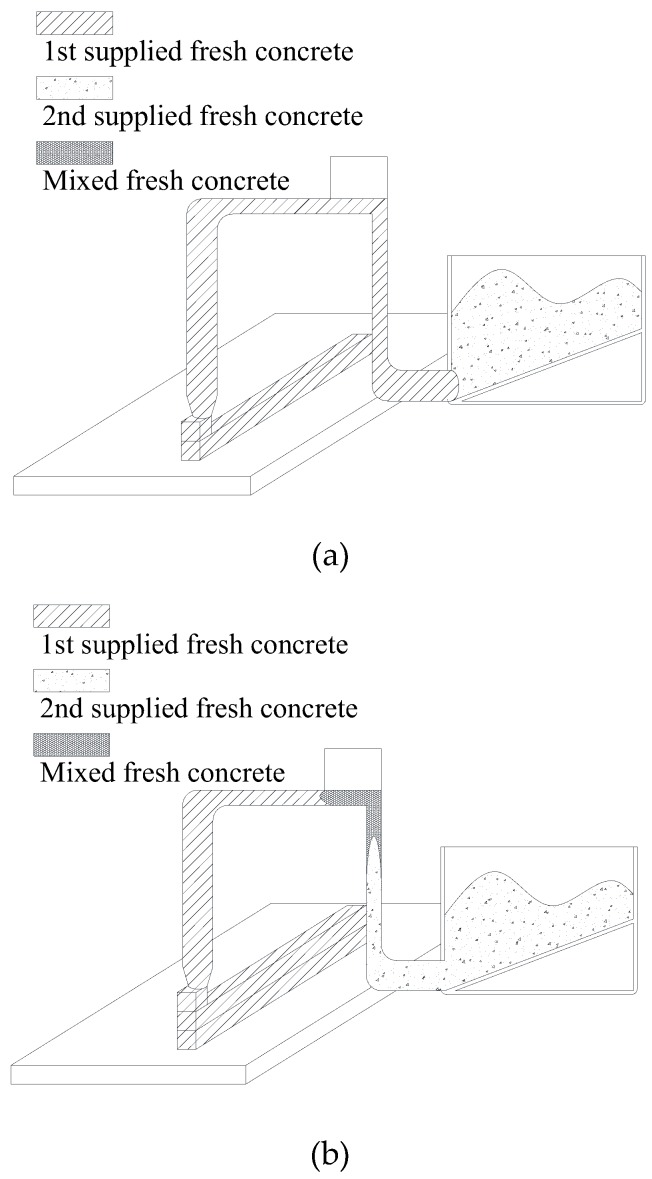
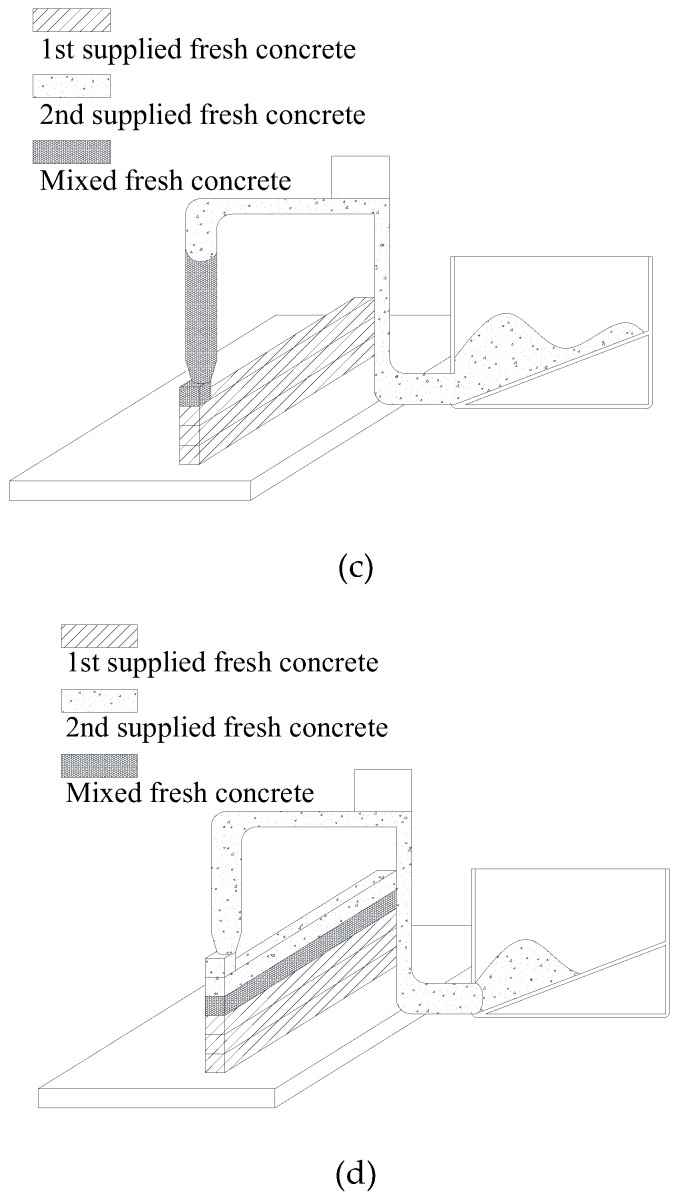
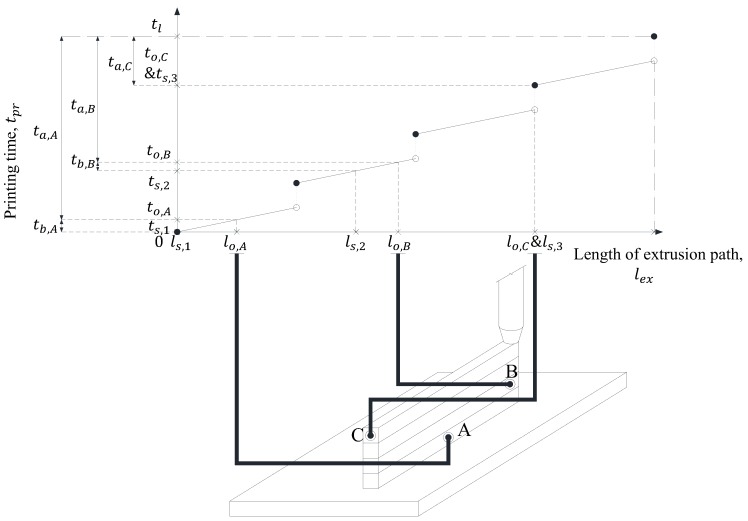
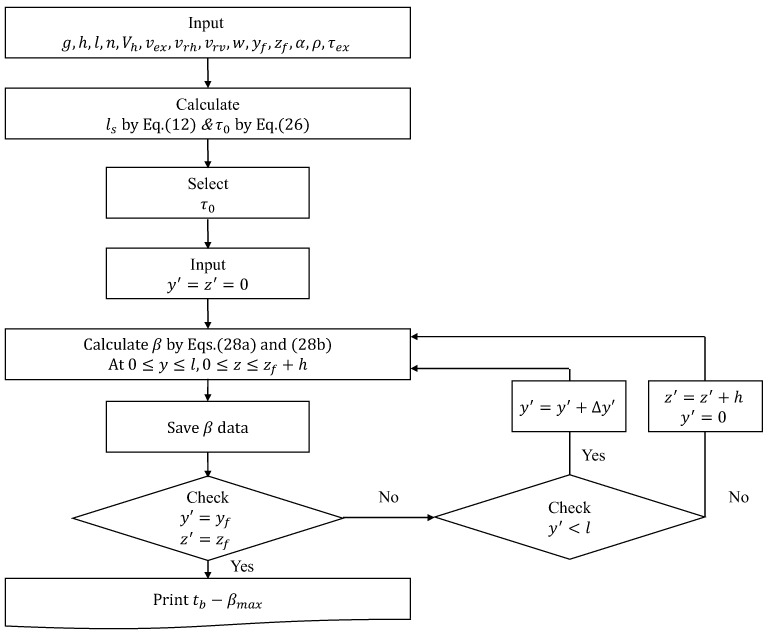
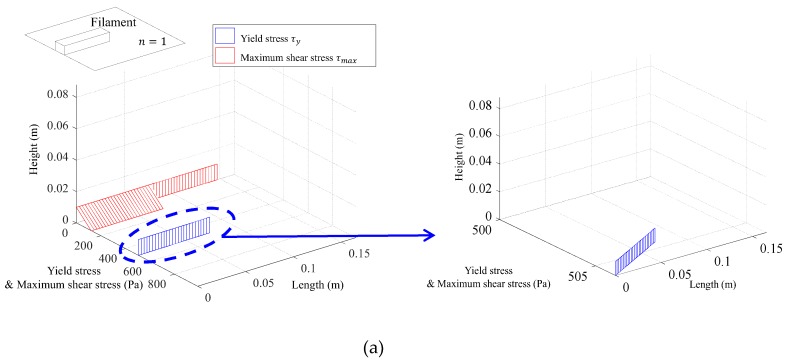
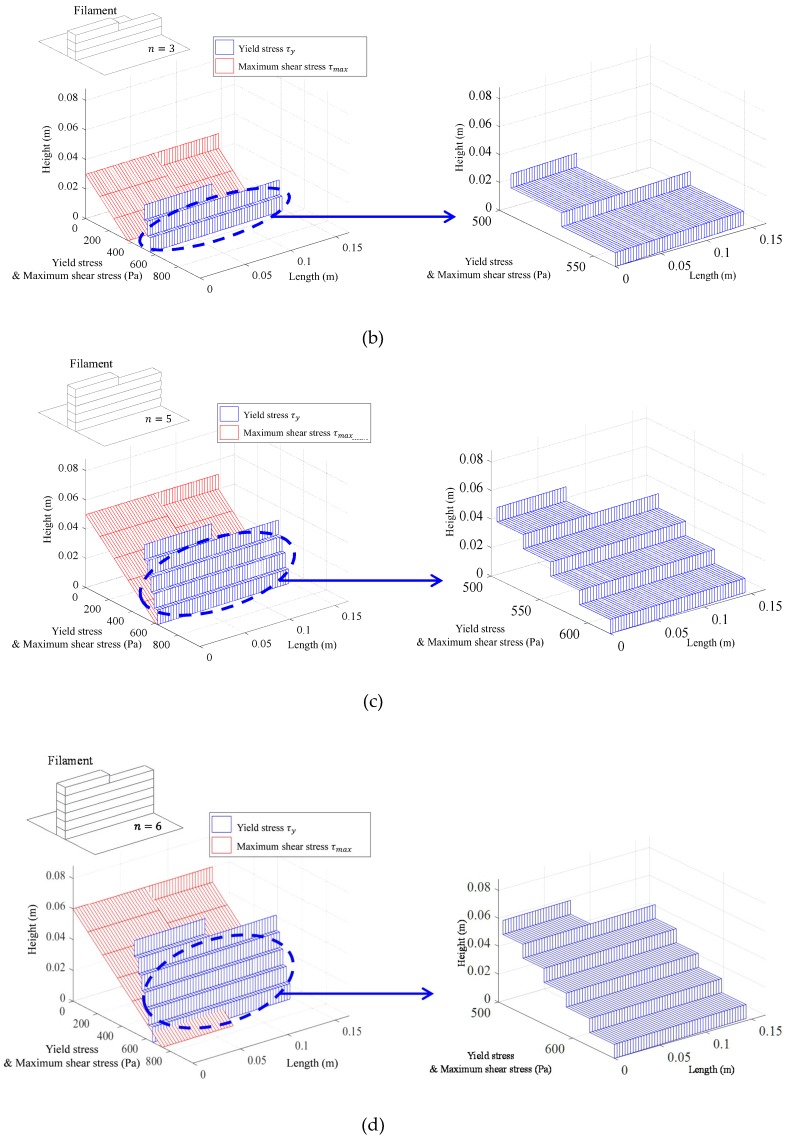
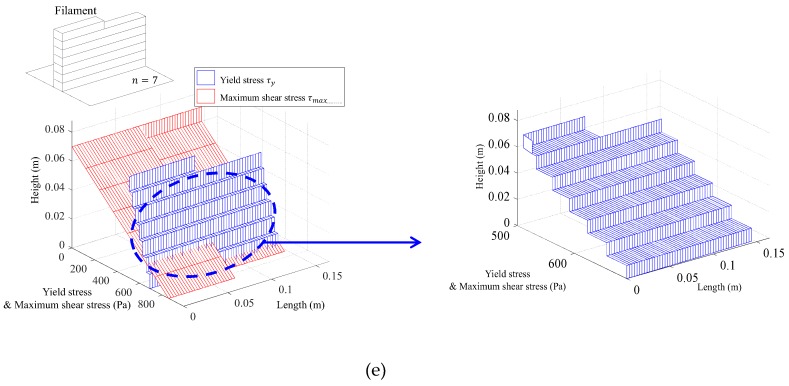
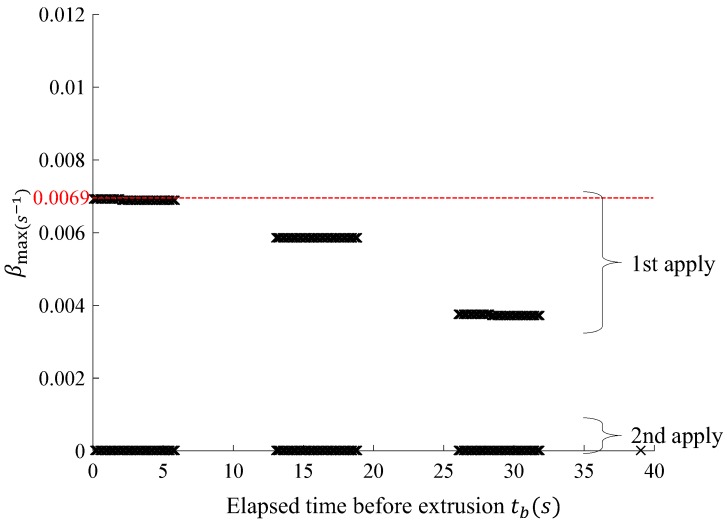
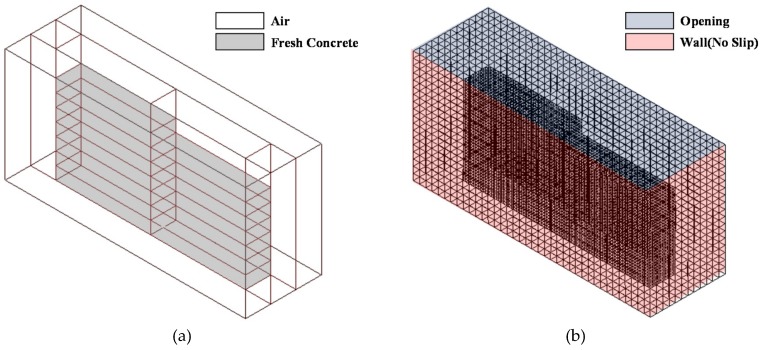
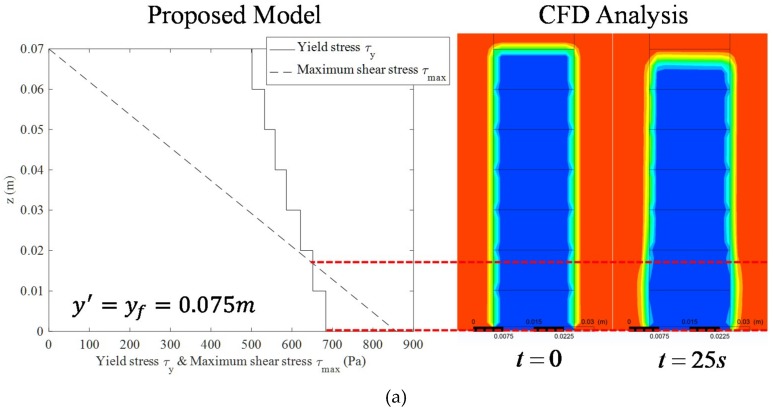
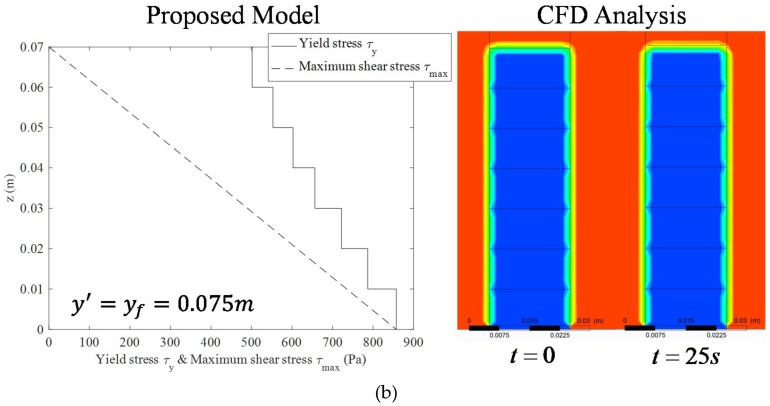
Fresh concrete used in 3D printing should ensure adequate yield stress, otherwise the printed concrete layer may suffer intolerable deformation or collapse during the printing process. In response to this issue, an analytical study was carried out to derive the initial yield stress and hardening coefficient of fresh concrete suitable for 3D printing. The maximum shear stress distribution of fresh concrete was calculated using a stress transformation equation derived from the equilibrium condition of forces. In addition, the elapsed time experienced by fresh concrete during the printing processes was estimated and was then substituted into the elapsed time-yield stress function to calculate the yield stress distribution. Based on these results, an algorithm capable of deriving both the initial yield stress and the hardening coefficient required for printing fresh concrete up to the target height was proposed and computational fluid dynamics (CFD) analyses were performed to verify the accuracy of the proposed model.

Keywords: 3D printing; buildability; concrete; mixture design; rheology.


Conflict of interest statement

The authors declare no conflict of interest.

Figures

Figure 1
Figure 1
Classification of printing start point at each layer. (a) Optimized printing start points for fastest printing speed; (b) Selected printing start points closest to specific location.
Figure 2
Figure 2
Classification of concrete supplying method. (a) Continuous supply; (b) Discontinuous supply.
Figure 2
Figure 2
Classification of concrete supplying method. (a) Continuous supply; (b) Discontinuous supply.
Figure 3
Figure 3
Schematic diagram of concrete printer.
Figure 4
Figure 4
Maximum shear stress distribution of built up fresh concrete. (a) Case of n=1 & fully built up layer; (b) Case of n=3 & half laminated layer.
Figure 5
Figure 5
Classification of printing path (lpr) & lextpr curve. (a) Vertically layered fresh concrete; (b) Classification of printing path (lpr); (c) lextpr curve.
Figure 5
Figure 5
Classification of printing path (lpr) & lextpr curve. (a) Vertically layered fresh concrete; (b) Classification of printing path (lpr); (c) lextpr curve.
Figure 6
Figure 6
Volume of supplied fresh concrete into hopper.
Figure 7
Figure 7
Extrusion phase of fresh concrete. (a) 1st supplied fresh concrete extrusion phase; (b) Fresh concrete mixing phase; (c) Mixed fresh concrete extrusion phase; (d) 2nd supplied fresh concrete extrusion phase.
Figure 7
Figure 7
Extrusion phase of fresh concrete. (a) 1st supplied fresh concrete extrusion phase; (b) Fresh concrete mixing phase; (c) Mixed fresh concrete extrusion phase; (d) 2nd supplied fresh concrete extrusion phase.
Figure 8
Figure 8
Calculation procedure of elapsed time according to element position.
Figure 9
Figure 9
Computational procedures to calculate τ0, αmax.
Figure 10
Figure 10
Computational procedures to calculate τ0, βmax.
Figure 11
Figure 11
Comparison of yield stress and maximum shear stress. (a) Maximum shear stress & yield stress at n=1; (b) Maximum shear stress & yield stress at n=3; (c) Maximum shear stress & yield stress at n=5; (d) Maximum shear stress & yield stress at n=6; (e) Maximum shear stress & yield stress at n=7.
Figure 11
Figure 11
Comparison of yield stress and maximum shear stress. (a) Maximum shear stress & yield stress at n=1; (b) Maximum shear stress & yield stress at n=3; (c) Maximum shear stress & yield stress at n=5; (d) Maximum shear stress & yield stress at n=6; (e) Maximum shear stress & yield stress at n=7.
Figure 12
Figure 12
tbβmax curve.
Figure 13
Figure 13
Modelling for CFD analysis. (a) Domain of model; (b) Mesh and boundary condition.
Figure 14
Figure 14
Validation of proposed model. (a) Comparison between proposed model and CFD analysis (case 1); (b) Comparison between proposed model and CFD analysis (case 2).
Figure 14
Figure 14
Validation of proposed model. (a) Comparison between proposed model and CFD analysis (case 1); (b) Comparison between proposed model and CFD analysis (case 2).

References

    1. Hanna A.S. Concrete formwork systems. Marcel Dekker; New York, NY, USA: 1999.
    1. Lee E.Y., Kim Y.S. An Analysis and Improvement of Free Form Building’s Construction Productivity Focused on Exposed Concrete Work. Korean J. Constr. Eng. Manag. 2014;15:38–46. doi: 10.6106/KJCEM.2014.15.3.038. - DOI
    1. Wu P., Wang J., Wang X. A critical review of the use of 3-D printing in the construction industry. Autom. Constr. 2016;68:21–31. doi: 10.1016/j.autcon.2016.04.005. - DOI
    1. Khoshnevis B. Automated construction by contour crafting—related robotics and information technologies. Autom. Constr. 2004;13:5–19. doi: 10.1016/j.autcon.2003.08.012. - DOI
    1. Cesaretti G., Dini E., De Kestelier X., Colla V., Pambaguian L. Building components for an outpost on the Lunar soil by means of a novel 3D printing technology. Acta Astronaut. 2014;93:430–450. doi: 10.1016/j.actaastro.2013.07.034. - DOI

LinkOut - more resources