. 2019 Feb 22;38(1):99.
doi: 10.1186/s13046-019-1078-2.

MiR-9 promotes tumorigenesis and angiogenesis and is activated by MYC and OCT4 in human glioma

Affiliations

MiR-9 promotes tumorigenesis and angiogenesis and is activated by MYC and OCT4 in human glioma

Xu Chen et al. J Exp Clin Cancer Res. .

Abstract

Background: Glioma, characterized by its undesirable prognosis and poor survival rate, is a serious threat to human health and lives. MicroRNA-9 (miR-9) is implicated in the regulation of multiple tumors, while the mechanisms underlying its aberrant expression and functional alterations in human glioma are still controversial.

Methods: Expressions of miR-9 were measured in GEO database, patient specimens and glioma cell lines. Gain- and loss-of-function assays were applied to identify the effects of miR-9 on glioma cells and HUVECs in vitro and in vivo. Potential targets of miR-9 were predicted by bioinformatics and further verified via in vitro experiments. Transcriptional regulation of miR-9 by MYC and OCT4 was determined in glioma cells.

Results: MiR-9 was frequently up-regulated in glioma specimens and cells, and could significantly enhance proliferation, migration and invasion of glioma cells. In addition, miR-9 could be secreted from glioma cells via exosomes and was then absorbed by vascular endothelial cells, leading to an increase in angiogenesis. COL18A1, THBS2, PTCH1 and PHD3 were verified as the direct targets of miR-9, which could elucidate the miR-9-induced malignant phenotypes in glioma cells. MYC and OCT4 were able to bind to the promoter region of miR-9 to trigger its transcription.

Conclusions: Our results highlight that miR-9 is pivotal for glioma pathogenesis and can be treated as a potential therapeutic target for glioma.

Keywords: Angiogenesis; Glioma; MYC; OCT4; Tumorigenesis; miR-9.


Conflict of interest statement

Ethics approval and consent to participate

This study was approved by the Medical Ethics Committee of Xijing Hospital affiliated to FMMU. This work was performed according to the ethical standards of Declaration of Helsinki and written informed consent was obtained from all the patients ahead of the experiments. Animal study was approved by the Institutional Animal Care and Use Committee of FMMU, and was strictly implemented according to institutional guidelines.

Consent for publication

Not applicable

Competing interests

The authors declare that they have no competing interests.

Publisher’s Note

Springer Nature remains neutral with regard to jurisdictional claims in published maps and institutional affiliations.

Figures

Fig. 1
Fig. 1
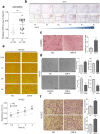
MiR-9 is frequently up-regulated in glioma tissues and facilitates glioma cell proliferation, migration and invasion. a MiR-9 expression levels were analyzed in the data from GSE4290 (N, n = 23; G, n = 153; left) and GSE15824 (N, n = 5; G, n = 30; right), respectively. N, normal tissues; G, glioma tissues. Data are represented as the mean ± s.d. (**P < 0.01 and ***P < 0.001). b MiR-9 expressions in the 3 normal (N) and 18 glioma (G) tissues were detected by qRT-PCR. Data are shown as the mean ± s.d. (*P < 0.05). c Proliferation of the A172 miR-9 mimic/NC cells was measured by MTT assay. Error bars represent the s.d. (*P < 0.05; n = 6 independent experiments). d Flow cytometry analysis was used to evaluate cell cycle of A172 miR-9 mimic/NC cells. Data are shown as the mean ± s.d. (*P < 0.05; n = 3 independent experiments). e Wound-healing assay was used to determine the migration of A172 miR-9 mimic/NC cells (upper). Photos were taken at 0, 24 and 48 h, respectively. Histogram was used for the statistical analysis of wound-healing assay for A172 miR-9 mimic/NC cells (lower). Scale bars represent 200 μm. Data are represented as the mean ± s.d. (*P < 0.05 and **P < 0.01; n = 3 independent experiments). f Migration (upper) and invasion (lower) of the A172 miR-9 mimic/NC cells were measured by the non-coated transwell and Matrigel-coated transwell assays, respectively. Scale bars represent 100 μm. Data are shown as the mean ± s.d. (*P < 0.05 and **P < 0.01; n = 3 independent experiments)
Fig. 2
Fig. 2
MiR-9 promotes angiogenesis, adhesion, migration and invasion of HUVECs. a MiR-9 expression levels in the serum of normal individuals (N, n = 8) and glioma patients (G, n = 22) were analyzed by using the data from GSE93850. Data are shown as the mean ± s.d. (**P < 0.01). b CD31 IHC staining was performed in normal (N) and glioma (G) tissues we collected. Scale bars represent 100 μm (upper) and 200 μm (lower). c Amount of capillary-like tubes generated by the HUVEC miR-9 mimic/NC cells was counted under a microscope 48 h post transfection. Scale bars represent 200 μm. Data are shown as the mean ± s.d. (**P < 0.01; n = 3 independent experiments). d Number and length of the novel sprouts derived from HUVEC miR-9 mimic/NC and HUVEC miR-9 inhibitor/NC cells were examined under a microscope. Scale bars represent 100 μm. Data are represented as the mean ± s.d. (**P < 0.01 and ***P < 0.001; n = 3 independent experiments). e Cell adhesive force assay was utilized to evaluate the adhesion ability of HUVEC miR-9 mimic/NC cells at 0.5, 1, 2 and 4 h. Data are shown as the mean ± s.d. (*P < 0.05, **P < 0.01 and ***P < 0.001; n = 3 independent experiments). Scale bars represent 500 μm. f Migration and invasion of the HUVEC miR-9 mimic/NC cells was determined through non-coated (upper) and Matrigel-coated (lower) transwell assays. Data are shown as the mean ± s.d. (**P < 0.01; n = 3 independent experiments). Scale bars represent 100 μm
Fig. 3
Fig. 3
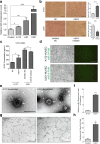
Secreted miR-9 derived from glioma cells enhances angiogenesis in HUVECs. a The HUVECs were cultured alone or co-cultured with A172, U87 and U251 cells, respectively. The expression of miR-9 in HUVECs was detected via qRT-PCR after co-culture. Data are presented as the mean ± s.d. (*P < 0.05, **P < 0.01 and ***P < 0.001; n = 3 independent experiments). b HUVECs were cultured with the conditional medium from A172 miR-9 mimic/NC and U251 miR-9 inhibitor/NC cells, and the amount of capillary-like tubes was determined after 48 h. Photos were taken and the tubes were counted under a microscope at the indicated time. Scale bars represent 200 μm. Data are represented as the mean ± s.d. (**P < 0.01 and ***P < 0.001; n = 3 independent experiments). c Expression level of VEGF in the cell lysates of the A172 miR-9 mimic/NC and U251 miR-9 inhibitor/NC cells were analyzed by ELISA assays. Error bars represent the s.d. (*P < 0.05; n = 3 independent experiments). d The HUVECs cultured via the conditional medium from A172 miR-9-FAM and U251 miR-9-FAM cells were observed by a fluorescence microscope. Scale bars represent 100 μm. e The A172 and U251 exosomes were observed and taken photos under a transmission electron microscope. Exosomes are marked by the white arrows. Scale bars represent 200 nm. f MiR-9 levels within the A172 and U251 exosomes were assessed by qRT-PCR analysis. Data are shown as the mean ± s.d. (***P < 0.001; n = 3 independent experiments). g and h Capillary-like tubes from the U251 exosomes or control treated HUVECs were taken photos (g) and counted (h) under a microscope. Scale bars represent 500 μm. Data are represented as the mean ± s.d. (**P < 0.01; n = 3 independent experiments)
Fig. 4
Fig. 4
MiR-9 induces glioma tumorigenesis and angiogenesis in vitro and in vivo. a Expression level of miR-9 in GL261 LV-miR-9 and GL261 LV-NC cells was detected by qRT-PCR. Data are shown as the mean ± s.d. (***P < 0.001; n = 3 independent experiments). b Proliferation ability of GL261 LV-miR-9 and GL261 LV-NC cells was measured via the colony formation assay. Data are presented as the mean ± s.d. (*P < 0.05; n = 3 independent experiments). c Brain sections of the mice from intracranial glioma model were used to perform the H&E staining and representative graphs were shown. Scale bars represent 1 mm. d Quantification of the tumor size. The tumor size was calculated according to the formula: (W2 x L) / 2, W < L. Data are shown as the mean ± s.d. (*P < 0.05; n = 5 independent experiments). e Body weights of mice in the intracranial glioma model were measured in the 0, 3, 6, 9, 12 days after injection. Data are represented as the mean ± s.d. (*P < 0.05; n = 5 independent experiments). f Overall survival of the experimental mice was analyzed by the Kaplan-Meier survival curve. Statistical significance was measured through P log-rank test. g Brain sections of the mice from the intracranial glioma model were used to perform the CD31 IHC staining and representative graphs were shown. Scale bars represent 1 mm (left) and 50 μm (right)
Fig. 5
Fig. 5
COL18A1, THBS2, PTCH1 and PHD3 are the direct downstream biotargets of miR-9. a Diagram of the interaction between the miR-9 (seed site) and target mRNAs (3’-UTRs). The wild-type and mutant sequences of 3’-UTRs are listed. b Endogenous levels of COL18A1, THBS2, PTCH1 and PHD3 in glioma cell lines (A172, U87 and U251) were detected by qRT-PCR, respectively. Data are shown as the mean ± s.d.. c Dual-luciferase reporter assays were used to measure the relative luciferase activity of the wild-type (WT) or mutant (MuT) reporters for COL18A1, THBS2, PTCH1 and PHD3 when co-transfected with the miR-9 mimic. Data are shown as the mean ± s.d. (N.S, no significance; **P < 0.01 and ***P < 0.001; n = 3 independent experiments). d and e Expression of potential targets regulated by miR-9 in A172 miR-9 mimic/NC and U251 miR-9 inhibitor/NC cells was determined by qRT-PCR (d) and western blot analysis (e). Error bars represent the s.d. (*P < 0.05, **P < 0.01 and ***P < 0.001; n = 3 independent experiments)
Fig. 6
Fig. 6
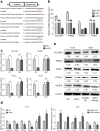
MiR-9 is directly activated by MYC and OCT4 in glioma cells. a Endogenous expression levels of the three miR-9 transcripts (miR-9-1, miR-9-2 and miR-9-3) were examined in A172 and U251 cells by qRT-PCR analysis. Data are shown as the mean ± s.d. (**P < 0.01 and ***P < 0.001; n = 3 independent experiments). b Endogenous expression levels of MYC and OCT4 were detected by qRT-PCR in A172 and U251 cells (left), and the model diagram exhibits the predicted MYC/OCT4 binding site on the miR-9-2 promoter region (right). Data are presented as the mean ± s.d. (*P < 0.05 and **P < 0.01; n = 3 independent experiments). c qRT-PCR analysis was applied to determine the miR-9 expression in A172 MYC/OCT4 and control cells and in U251 MYC/OCT4 siRNA and siNC cells. Error bars represent the s.d. (*P < 0.05, **P < 0.01 and ***P < 0.001; n = 3 independent experiments). d Dual-luciferase reporter assays were used to assess the relative luciferase activity of vectors with the wild-type or mutant OCT4 binding site upon co-transfection with an OCT4-expressing vector or control. Data are presented as the mean ± s.d. (N.S, no significance; ***P < 0.001; n = 3 independent experiments). e Diagram of the location and amplified fragments of the five ChIP primers on the promoter region of miR-9-2. f Enrichment of MYC, OCT4, H3K4me3 and H3K27me3 at the miR-9-2 promoter region was tested by ChIP assay in the U251 cells. Data are shown as the mean ± s.d. (N.S, no significance; *P < 0.05, **P < 0.01 and ***P < 0.001; n = 3 independent experiments). g Expression levels of the three miR-9 transcripts in the A172 MYC/OCT4 and control cells and in the U251 MYC/OCT4 siRNA and siNC cells. Error bars represent the s.d. (N.S, no significance; *P < 0.05, **P < 0.01 and ***P < 0.001; n = 3 independent experiments)

Similar articles

Cited by

References

    1. Miller CR, Glioblastoma PA. Arch Pathol Lab Med. 2007;131(3):397–406. - PubMed
    1. Wen PY, Kesari S. Malignant gliomas in adults. New Engl J Med. 2008;359(5):492–507. doi: 10.1056/NEJMra0708126. - DOI - PubMed
    1. Bian EB, Li J, Xie YS, Zong G, Li J, Zhao B. LncRNAs: new players in gliomas, with special emphasis on the interaction of lncRNAs with EZH2. J Cell Physiol. 2015;230(3):496–503. doi: 10.1002/jcp.24549. - DOI - PubMed
    1. Ostrom QT, Gittleman H, Stetson L, Virk SM, Barnholtz-Sloan JS. Epidemiology of gliomas. Cancer Treat Res. 2015;163:1–14. doi: 10.1007/978-3-319-12048-5_1. - DOI - PubMed
    1. Ames H, Halushka MK, Rodriguez FJ. miRNA regulation in gliomas: usual suspects in glial tumorigenesis and evolving clinical applications. J Neuropathol Exp Neurol. 2017;76(4):246–254. doi: 10.1093/jnen/nlx005. - DOI - PubMed

MeSH terms