

Mechanics of the Formation, Interaction, and Evolution of Membrane Tubular Structures
- PMID: 30795870
- PMCID: PMC6401365
- DOI: 10.1016/j.bpj.2019.01.032
Mechanics of the Formation, Interaction, and Evolution of Membrane Tubular Structures
Abstract
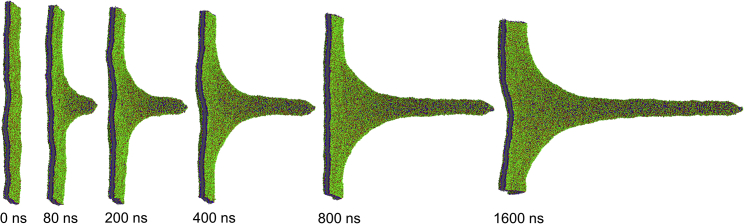
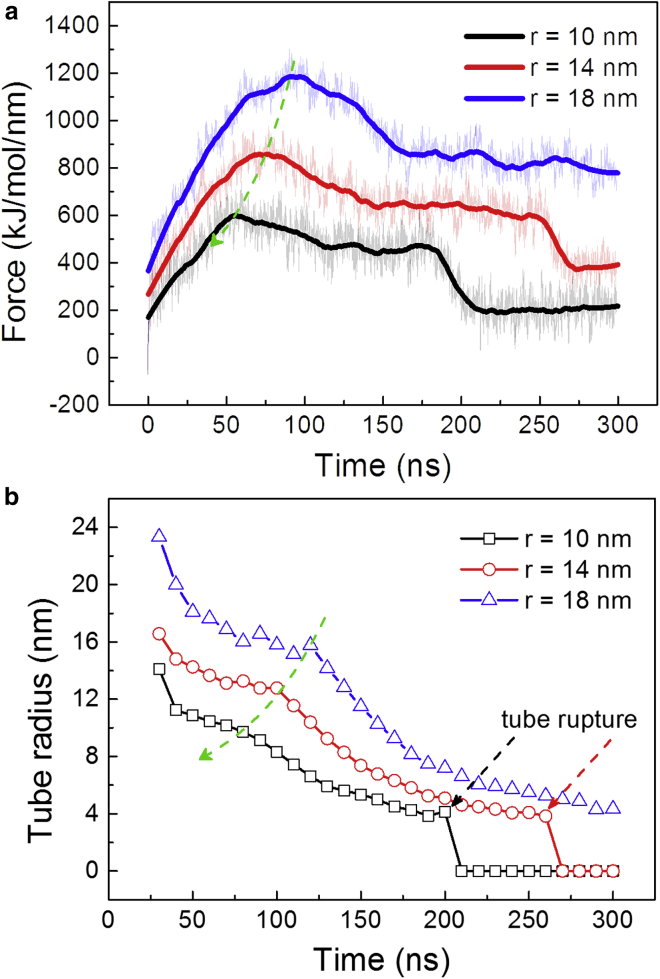
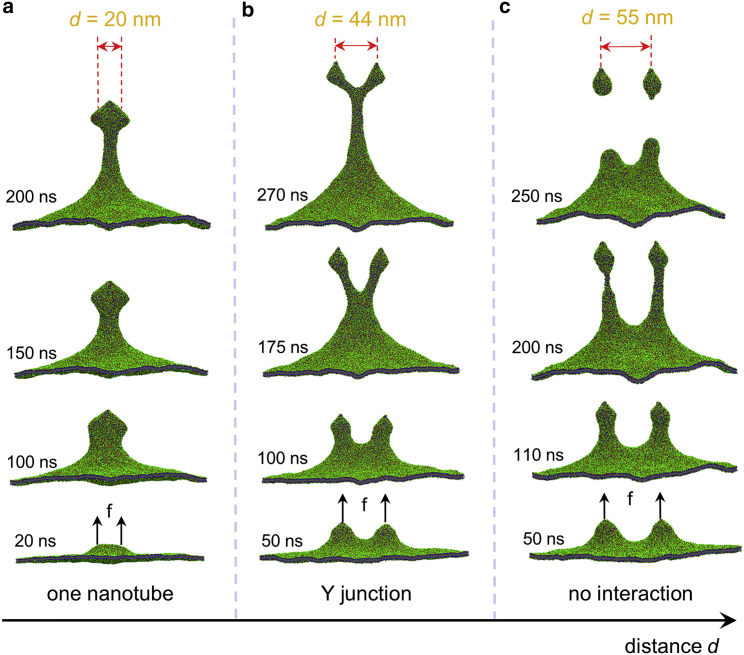
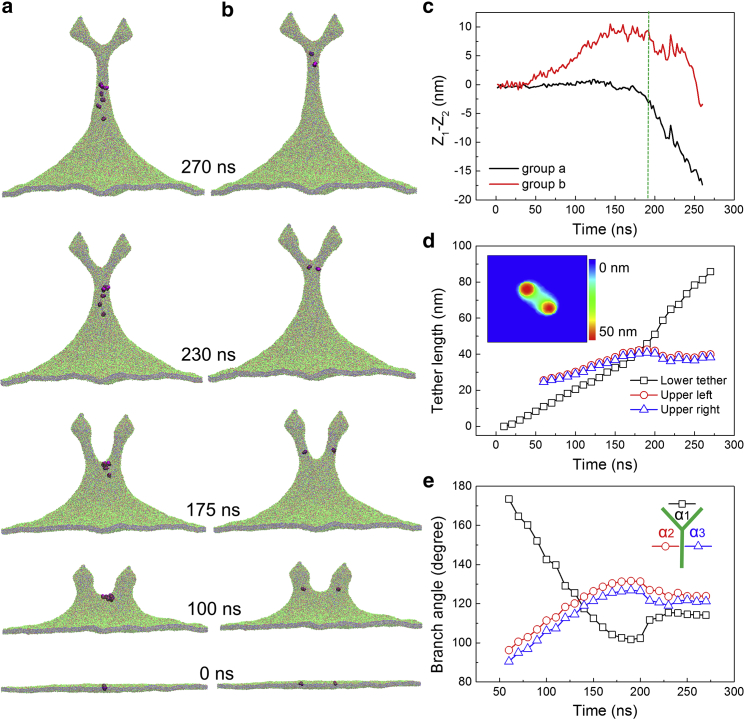
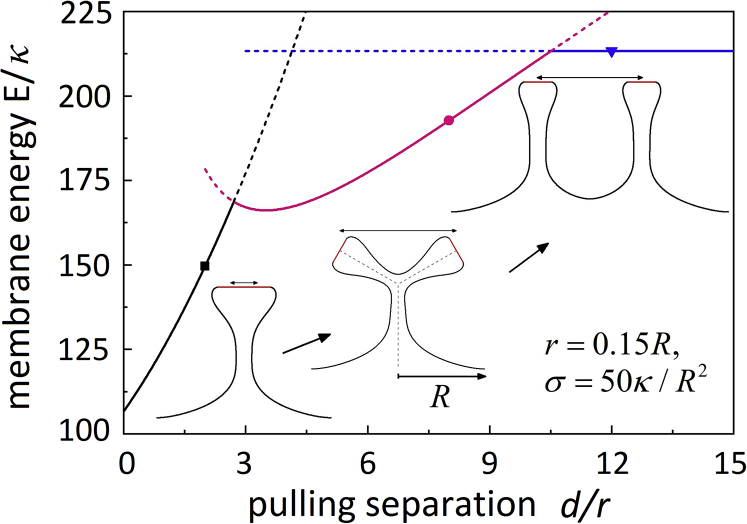
Membrane nanotubes, also known as membrane tethers, play important functional roles in many cellular processes, such as trafficking and signaling. Although considerable progresses have been made in understanding the physics regulating the mechanical behaviors of individual membrane nanotubes, relatively little is known about the formation of multiple membrane nanotubes due to the rapid occurring process involving strong cooperative effects and complex configurational transitions. By exerting a pair of external extraction upon two separate membrane regions, here, we combine molecular dynamics simulations and theoretical analysis to investigate how the membrane nanotube formation and pulling behaviors are regulated by the separation between the pulling forces and how the membrane protrusions interact with each other. As the force separation increases, different membrane configurations are observed, including an individual tubular protrusion, a relatively less deformed protrusion with two nanotubes on its top forming a V shape, a Y-shaped configuration through nanotube coalescence via a zipper-like mechanism, and two weakly interacting tubular protrusions. The energy profile as a function of the separation is determined. Moreover, the directional flow of lipid molecules accompanying the membrane shape transition is analyzed. Our results provide new, to our knowledge, insights at a molecular level into the interaction between membrane protrusions and help in understanding the formation and evolution of intra- and intercellular membrane tubular networks involved in numerous cell activities.
Copyright © 2019 Biophysical Society. Published by Elsevier Inc. All rights reserved.
Figures
Similar articles
-
Size-dependent formation of membrane nanotubes: continuum modeling and molecular dynamics simulations.Phys Chem Chem Phys. 2018 Jan 31;20(5):3474-3483. doi: 10.1039/c7cp06212e. Phys Chem Chem Phys. 2018. PMID: 29335691
-
Membrane nanotube pearling restricted by confined polymers.Soft Matter. 2018 Nov 28;14(46):9383-9392. doi: 10.1039/c8sm01711e. Soft Matter. 2018. PMID: 30418454
-
Mechanics of cellular packing of nanorods with finite and non-uniform diameters.Nanoscale. 2018 Aug 7;10(29):14090-14099. doi: 10.1039/c8nr04110e. Epub 2018 Jul 12. Nanoscale. 2018. PMID: 29999084
-
How filopodia pull: what we know about the mechanics and dynamics of filopodia.Cytoskeleton (Hoboken). 2013 Oct;70(10):590-603. doi: 10.1002/cm.21130. Epub 2013 Sep 3. Cytoskeleton (Hoboken). 2013. PMID: 23959922 Review.
-
The matrix environmental and cell mechanical properties regulate cell migration and contribute to the invasive phenotype of cancer cells.Rep Prog Phys. 2019 Jun;82(6):064602. doi: 10.1088/1361-6633/ab1628. Epub 2019 Apr 4. Rep Prog Phys. 2019. PMID: 30947151 Review.
Cited by
-
Biophysical Interaction Landscape of Mycobacterial Mycolic Acids and Phenolic Glycolipids with Host Macrophage Membranes.ACS Appl Bio Mater. 2023 Dec 18;6(12):5555-5562. doi: 10.1021/acsabm.3c00748. Epub 2023 Nov 28. ACS Appl Bio Mater. 2023. PMID: 38015441 Free PMC article.
-
Mechanical properties of tunneling nanotube and its mechanical stability in human embryonic kidney cells.Front Cell Dev Biol. 2022 Sep 27;10:955676. doi: 10.3389/fcell.2022.955676. eCollection 2022. Front Cell Dev Biol. 2022. PMID: 36238686 Free PMC article.
References
-
- Rustom A., Saffrich R., Gerdes H.H. Nanotubular highways for intercellular organelle transport. Science. 2004;303:1007–1010. - PubMed
-
- Watkins S.C., Salter R.D. Functional connectivity between immune cells mediated by tunneling nanotubules. Immunity. 2005;23:309–318. - PubMed
-
- Sott K., Lobovkina T., Orwar O. Controlling enzymatic reactions by geometry in a biomimetic nanoscale network. Nano Lett. 2006;6:209–214. - PubMed
Publication types
MeSH terms
LinkOut - more resources
Full Text Sources
Research Materials
