. 2019 Mar:41:200-213.
doi: 10.1016/j.ebiom.2019.01.035. Epub 2019 Feb 19.

LncRNA EPB41L4A-AS1 regulates glycolysis and glutaminolysis by mediating nucleolar translocation of HDAC2

Affiliations

LncRNA EPB41L4A-AS1 regulates glycolysis and glutaminolysis by mediating nucleolar translocation of HDAC2

Meijian Liao et al. EBioMedicine. 2019 Mar.

Erratum in

Abstract

Background: LncRNAs have been found to be involved in various aspects of biological processes. In this study, we aimed to uncover the molecular mechanisms of lncRNA EPB41L4A-AS1 in regulating glycolysis and glutaminolysis in cancer cells.

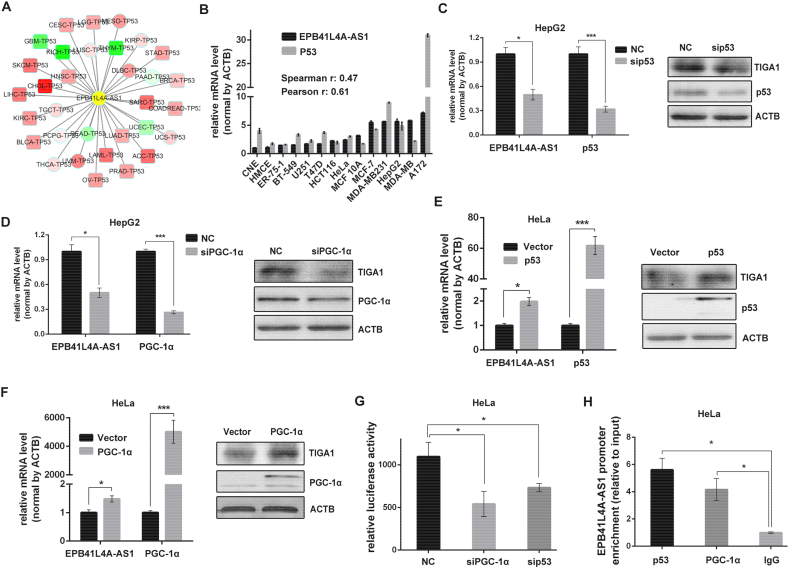
Methods: The expression of EPB41L4A-AS1 in cancer patients was analyzed in TCGA and GEO datasets. The level of cellular metabolism was determined by extracellular flux analyzer. The relationship between p53 and EPB41L4A-AS1 was explored by qRT-PCR, luciferase assay and ChIP assay. The interactions between EPB41L4A-AS1 and HDAC2 or NPM1 were determined by RNA immunoprecipitation, RNA pull-down assay and RNA-FISH- immunofluorescence.

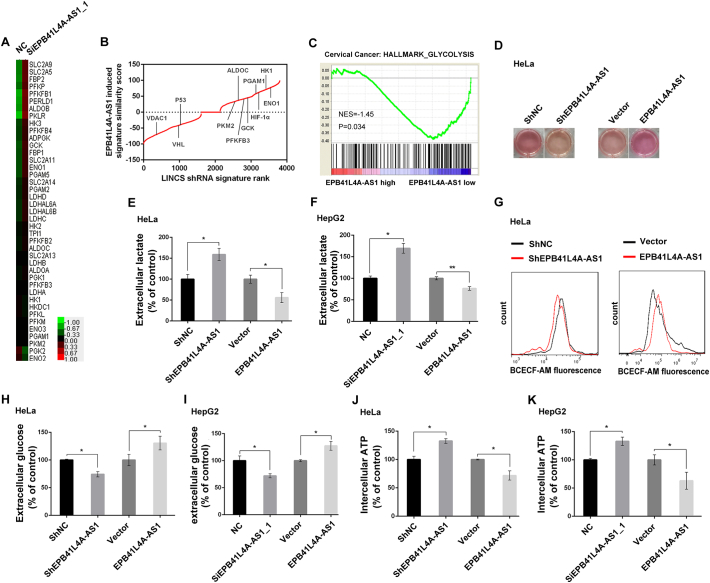
Findings: EPB41L4A-AS1 was a p53-regulated gene. Low expression and deletion of lncRNA EPB41L4A-AS1 were found in a variety of human cancers and associated with poor prognosis of cancer patients. Knock down EPB41L4A-AS1 expression triggered Warburg effect, demonstrated as increased aerobic glycolysis and glutaminolysis. EPB41L4A-AS1 interacted and colocalized with HDAC2 and NPM1 in nucleolus. Silencing EPB41L4A-AS1 reduced the interaction between HDAC2 and NPM1, released HDAC2 from nucleolus and increased its distribution in nucleoplasm, enhanced HDAC2 occupation on VHL and VDAC1 promoter regions, and finally accelerated glycolysis and glutaminolysis. Depletion of EPB41L4A-AS1 increased the sensitivity of tumor to glutaminase inhibitor in tumor therapy.

Interpretation: EPB41L4A-AS1 functions as a repressor of the Warburg effect and plays important roles in metabolic reprogramming of cancer.

Keywords: Cancer metabolism; EPB41L4A-AS1; Glutaminolysis; Glycolysis; HDAC2.


Figures

Fig. 1
Fig. 1
EPB41L4A-AS1 expression was downregulated in human cancers. A. Analysis the copy numbers of EPB41L4A-AS1 across all chromosomes from 475 cancer samples by the Progenetix histoplot. B. EPB41L4A-AS1 is significantly downregulated in cervical, liver, breast and bladder cancer compared with normal tissues (upper panels). Kaplan-Meier survival curves analyzing EPB41L4A-AS1 expression in these four types of cancer tissues (lower panels). C-D. Immunohistochemical staining of TIGA1 in cervical cancer (C) and liver cancer D) tissues. Quantitative analysis of TIGA1 intensity in 125 cervical cancer patients (C, right) and 92 liver cancer patients (D, right). –, score 0; +, score 1–3; ++, score 4–6; +++, score 7–9. Data are represented as means ± SD, *P < 0.05; **P < 0.01; ***P < 0.001, Mann-Whitney test.
Fig. 2
Fig. 2
EPB41L4A-AS1 expression was regulated by p53 and PGC-1α. A. Correlation between p53 mRNA and EPB41L4A-AS1 expression in different types of cancer. The -Spearman correlation coefficient is shown as color intensity, red indicates EPB41L4A-AS1 positive relevant to p53 and green indicates negative correlation. The square frame indicates P < 0.05 and circles indicates P ≧ 0.05. B. Correlation between p53 mRNA and EPB41L4A-AS1 expression in 14 different cancer cell lines by qRT-PCR (n = 3). C-D. EPB41L4A-AS1 and TIGA1 expression in HepG2 cells depleted with p53 or PGC-1α (n = 3). E–F. EPB41L4A-AS1 and TIGA1 expression in HeLa cells transfected with GFP-p53 or GFP-PGC-1α plasmids (n = 3). G. PGL3-enhancer vector containing EPB41L4A-AS1 promoter was co-transfected with NC, sip53 or siPGC-1α into HepG2 cells, relative luciferase activity was determined by bioluminescence (n = 3). H. HeLa cells transfected with GFP-p53 or GFP-PGC-1α for 48 h, p53 or PGC-1α occupation on EPB41L4A-AS1 promoter was evaluated by ChIP-qPCR, IgG was used as negative control (n = 3). Data are represented as means ± SD, *P < 0.05; **P < 0.01, ***P < 0.001, unpaired, two-tailed, Student's t-test. (For interpretation of the references to color in this figure legend, the reader is referred to the web version of this article.)
Fig. 3
Fig. 3
EPB41L4A-AS1 regulates glucose metabolism. A. Heatmap analysis of cDNA microarray of glycolysis related genes expression in EPB41L4A-AS1 knockdown HeLa cells. B. Evaluation of the EPB41L4A-AS1 signature in the LINCS. In the plot shown, genes are ranked according to the similarity score in their induced expression patterns with those of the EPB41L4A-AS1 signature. C. GSEA enrichment score curve shows glycolysis related to low expression of EPB41L4A-AS1 in 300 cervical carcinoma patients (GEO: GSE44001). The green curve indicates the enrichment score (ES). The negative enrichment score in EPB41L4A-AS1 low expression end indicates up-regulation of glycolysis pathway in the samples with EPB41L4A-AS1 low expression. D. HeLa cells with EPB41L4A-AS1 stable knockdown or transient overexpression were cultured for 48 h. The culture medium was more acidified in EPB41L4A-AS1 knockdown cells and less in EPB41L4A-AS1 overexpressing cells, as indicated by the colors. E-F. Extracellular lactate levels were measured in HeLa (E) and HepG2 (F) cells with EPB41L4A-AS1 knockdown or overexpression (n = 3). G. Intercellular pH by flow cytometry using a pH-sensitive dye (BCECF-AM) in HeLa cells after EPB41L4A-AS1 stable knockdown (left) and overexpression (right) for 48 h. H—I. Extracellular glucose levels were measured in HeLa (H) and HepG2 (I) cells with EPB41L4A-AS1 knockdown or overexpression (n = 3). J-K. Intracellular ATP levels were measured in HeLa (J) and HepG2 (K) cells with EPB41L4A-AS1 knockdown or overexpression (n = 3). Data are represented as means ± SD, *P < 0.05; **P < 0.01, unpaired, two-tailed, Student's t-test. (For interpretation of the references to color in this figure legend, the reader is referred to the web version of this article.)
Fig. 4
Fig. 4
EPB41L4A-AS1 regulates glycolysis through VHL/HIF-1α pathway. A-D. Seahorse XFp demonization ECAR in HeLa and HepG2 cells with EPB41L4A-AS1 knockdown (A and C) or overexpression (B and D). Black arrows indicate the time point of cell treatment. The lower panels are the quantification of glycolysis, glycolytic capacity and glycolytic reserve from the upper panels, respectively (n = 3). E. Immunoblotting analysis of HIF-1α, HK2, PFKL, PFKPB3 and ACTB in HeLa cells with EPB41L4A-AS1 stable knockdown or transient overexpression. F. The mRNA expression of VHL and HIF-1α in HeLa cells with EPB41L4A-AS1 stable knockdown (n = 3). Data are represented as means ± SD, *P < 0.05; **P < 0.01, unpaired, two-tailed, Student's t-test.
Fig. 5
Fig. 5
EPB41L4A-AS1 regulates glutamate metabolism. A-D. Intercellular glutamate (A-B) and α-KG (C-D) levels were measured in HeLa and HepG2 cells with EPB41L4A-AS1 knockdown or overexpression (n = 3). E-F. Mitochondria fuels oxidation dependency assay in HeLa (E) and HepG2 (F) cells with EPB41L4A-AS1 knockdown or overexpression for (n = 3). Data are represented as means ± SD, *P < 0.05; **P < 0.01, unpaired, two-tailed, Student's t-test.
Fig. 6
Fig. 6
EPB41L4A-AS1 regulates mitochondria respiratory through glutamine metabolism. A-D. Seahorse XFp assays measured OCR in HeLa and HepG2 cells with EPB41L4A-AS1 knockdown (A and C) or overexpression (B and D). Black arrows indicate the time point of cells treatment. The lower panels are quantification of basal respiration, ATP production, maximal respiration, spare respiratory capacity, proton leak and non-mitochondria respiration from the upper panels, respectively (n = 3). E. ROS levels by flow cytometry using mitosox in HeLa cells after EPB41L4A-AS1 stable knockdown (left) or overexpression (right). F. Immunoblotting analysis of SN2, ATF4, phosphor-eIF2α, SDHA, PDH and ACTB in HeLa with EPB41L4A-AS1 stable knockdown or instant overexpression for 48 h. G. Immunoblotting analysis of ATF4, VDAC, and phosphor-eIF2α in HeLa cells transfected with NC or siVDAC1. H. Immunoblotting analysis of ATF4, VDAC, and phosphor-eIF2α in HeLa cells treatment with erastin (50 μM, 24 h). I-J. VDAC protein (I) and mRNA (J) level was determined in HeLa cells with EPB41L4A-AS1 stable knockdown. K. Correlation between EPB41L4A-AS1 and VDAC1 mRNA expression was determined by Spearman coefficient analysis in 309 cervical carcinoma patients in TCGA database. All qRT-PCR were normalized by ACTB. Data are represented as means ± SD, *P < 0.05; **P < 0.01, unpaired, two-tailed, Student's t-test.
Fig. 7
Fig. 7
EPB41L4A-AS1 regulates VHL and VDAC1 expression through interaction with HDAC2. A. The mRNA expression of VHL and VDAC1 in HeLa cells transfected with EPB41L4A-AS1 plasmids with or without ATG mutation for 48 h (n = 3). B. The distribution of EPB41L4A-AS1 RNA in cytosol and nucleus, NEAT1 was used as a positive control (n = 3). C. Immunoblotting analysis of H3K27ac level in HeLa cells with EPB41L4A-AS1 stable knockdown. D. ChIP-qPCR analysis H3K27ac enrichment on VDAC1 and VHL promoters (n = 3). E. RIP-qPCR analysis EPB41L4A-AS1 interaction with HDAC2, HDAC1 or p300, IgG as negative control (n = 3). F. The interaction of different fragments of EPB41L4A-AS1 RNA with HDAC2 and H3K27ac was analyzed by RNA-pulldown assay. G. RIP-qPCR analysis EPB41L4A-AS1 interaction with HDAC2 and NPM1 (n = 3). H. RNA-FISH and immunofluorescence staining of EPB41L4A-AS1 RNA (red) and NPM1 protein (green) in the nucleolus. I. RNA-FISH and immunofluorescence staining of EPB41L4A-AS1 RNA (red) and HDAC2 protein (green) in the nucleus. J. HeLa cells with or without EPB41L4A-AS1 stable knockdown were performed for immunoprecipitation with anti-HDAC2 and anti-NPM1 antibody. Immunoprecipitation was analyzed by western blotting. K. HDAC2 enrichment in VDAC1 and VHL promoters was determined by ChIP-qPCR analysis (n = 3). L. VHL and VDAC1 expression in HeLa cells transfected with siHDAC2 for 48 h (n = 3). M. EPB41L4A-AS1 stable knockdown cells or control cells transfected with NC or siHDAC2 for 48 h, qRT-PCR analyzing the expression of VHL and VDAC1 (n = 3). N. VDAC1 and VHL mRNA levels in EPB41L4A-AS1 stable knockdown cells treatment with TSA for 4 h (n = 3). Data are represented as means ± SD, *P < 0.05; **P < 0.01; ***P < 0.001; ****P < 0.0001, unpaired, two-tailed, Student's t-test. (For interpretation of the references to color in this figure legend, the reader is referred to the web version of this article.)
Fig. 8
Fig. 8
EPB41L4A-AS1 knockdown increases the antitumor effect of glutaminase inhibitor in vivo. A. Colony formation assay in control HeLa cells or EPB41L4A-AS1 stable knockdown cells treated with or without compound 968 (10 nM, 10 days), DMSO as control. B. HeLa cells stably transfected with ShEPB41L4A-AS1 or ShNC were injected subcutaneously into the flank of nude mice. ShEPB41L4A-AS1 promotes tumorigenesis compared with ShNC at day 8, 10, 12, and 14 of injection. C. ShEPB41L4A-AS1 promotes tumor growth in vivo. When the average size of the tumor reached approximately 75 mm3, mice were treated with compound 968 or DMSO every other day by intraperitoneal injections. Tumor volumes were measured and plotted in a graph. D-E. Tumor images (D) and weight (E). F-G. The expression levels of EPB41L4A-AS1 RNA (F) and TIGA1 protein (G) in tumors. H. Model depicting the role of EPB41L4A-AS1 in glycolysis and glutamine metabolism reprogramming. Data are represented as means ± SD, *P < 0.05; **P < 0.01, unpaired, two-tailed, Student's t-test.

Similar articles

Cited by

References

    1. Warburg O., Wind F., Negelein E. The metabolism of tumors in the body. J Gen Physiol. 1927;8(6):519–530. - PMC - PubMed
    1. Warburg O. On the origin of cancer cells. Science. 1956;123(3191):309–314. - PubMed
    1. Schuurbiers O.C., Meijer T.W., Kaanders J.H., Looijen-Salamon M.G., de Geus-Oei L.F., van der Drift M.A. Glucose metabolism in NSCLC is histology-specific and diverges the prognostic potential of 18FDG-PET for adenocarcinoma and squamous cell carcinoma. J Thorac Oncol. 2014;9(10):1485–1493. - PubMed
    1. Upadhyay M., Samal J., Kandpal M., Singh O.V., Vivekanandan P. The Warburg effect: insights from the past decade. Pharmacol Ther. 2013;137(3):318–330. - PubMed
    1. Koppenol W.H., Bounds P.L., Dang C.V. Otto Warburg's contributions to current concepts of cancer metabolism. Nat Rev Cancer. 2011;11(5):325–337. - PubMed