. 2019 Jun 1;25(11):3259-3265.
doi: 10.1158/1078-0432.CCR-18-3034. Epub 2019 Feb 22.

Comparison of Biomarker Assays for EGFR: Implications for Precision Medicine in Patients with Glioblastoma

Affiliations

Comparison of Biomarker Assays for EGFR: Implications for Precision Medicine in Patients with Glioblastoma

Andrew B Lassman et al. Clin Cancer Res. .

Abstract

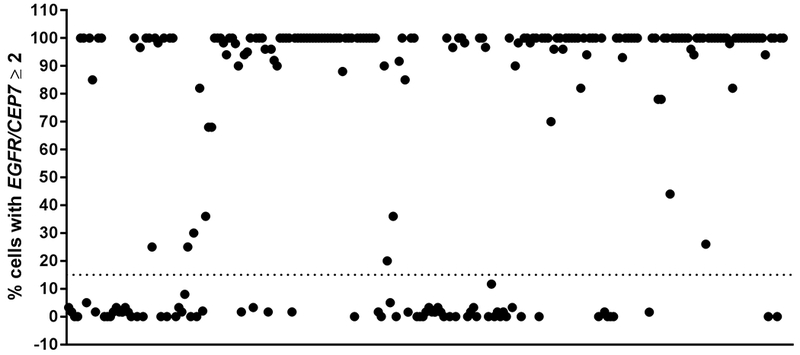
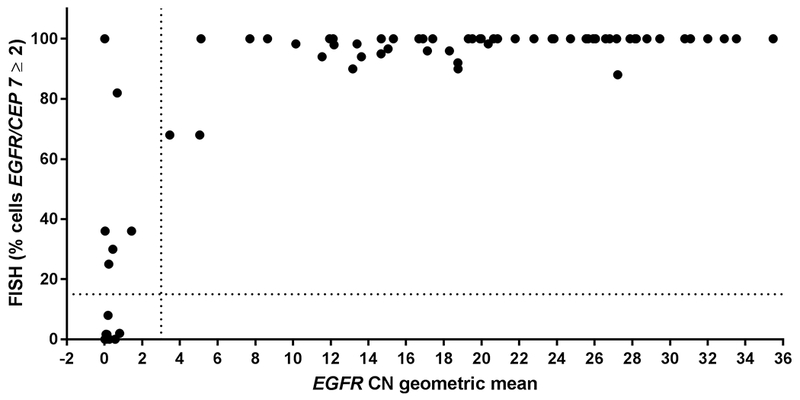
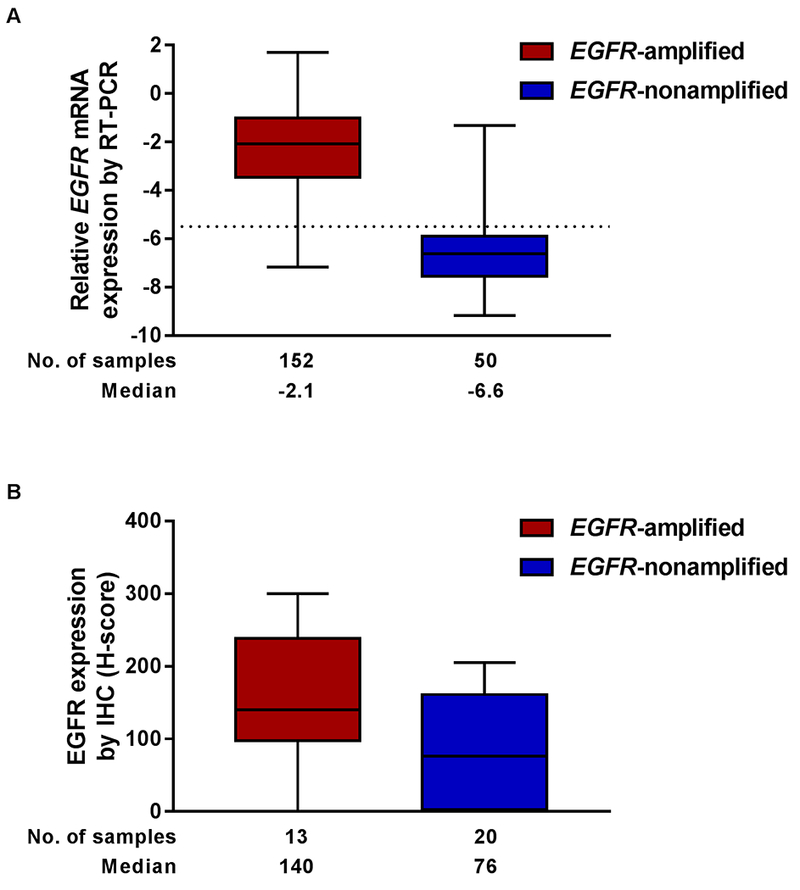
Purpose: Patients with glioblastoma (GBM) have a poor prognosis and are in desperate need of better therapies. As therapeutic decisions are increasingly guided by biomarkers, and EGFR abnormalities are common in GBM, thus representing a potential therapeutic target, we systematically evaluated methods of assessing EGFR amplification by multiple assays. Specifically, we evaluated correlation among fluorescence in situ hybridization (FISH), a standard assay for detecting EGFR amplification, with other methods.Experimental Design: Formalin-fixed, paraffin-embedded tumor samples were used for all assays. EGFR amplification was detected using FISH (N = 206) and whole-exome sequencing (WES, N = 74). EGFR mRNA expression was measured using reverse transcription-polymerase chain reaction (RT-PCR, N = 206) and transcriptome profiling (RNAseq, N = 64). EGFR protein expression was determined by immunohistochemistry (IHC, N = 34). Significant correlations among various methods were determined using Cohen's kappa (κ = 0.61-0.80 defines substantial agreement) or R 2 statistics.

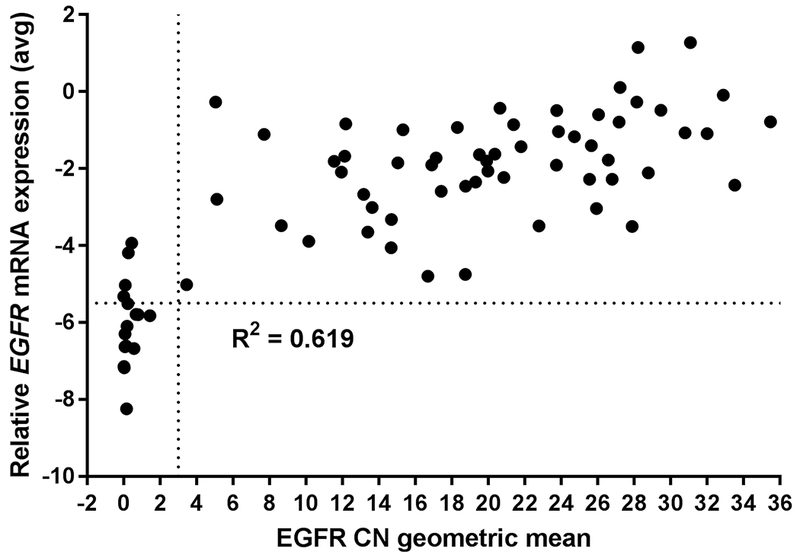
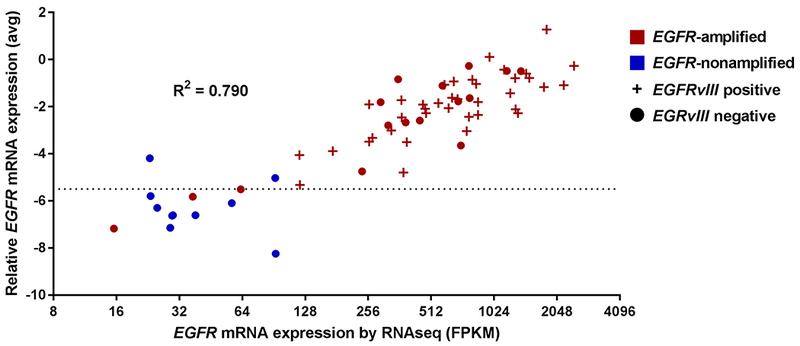
Results: EGFR mRNA expression levels by RNA sequencing (RNAseq) and RT-PCR were highly correlated with EGFR amplification assessed by FISH (κ = 0.702). High concordance was also observed when comparing FISH to WES (κ = 0.739). RNA expression was superior to protein expression in delineating EGFR amplification.

Conclusions: Methods for assessing EGFR mRNA expression (RT-PCR, RNAseq) and copy number (WES), but not protein expression (IHC), can be used as surrogates for EGFR amplification (FISH) in GBM. Collectively, our results provide enhanced understanding of available screening options for patients, which may help guide EGFR-targeted therapeutic approaches.

Trial registration: ClinicalTrials.gov NCT01800695.


Figures

Figure 1.
Figure 1.. FISH amplification cut-off in tumor samples.
Tumors were deemed positive for EGFR amplification if ≥ 15% (dotted line) of cells demonstrated amplification (defined as EGFR/CEP 7 ratio was ≥ 2). FISH performed on 206 samples; 3 are excluded here (FISH failure).
Figure 2.
Figure 2.. Correlation of EGFR amplification by FISH with copy number (CN) determined by WES.
X-axis, geometric mean of EGFR copy number (all exons except exons 2–7); linear scale. Vertical dotted line at 3 delineates EGFR-amplified (to the right) vs –nonamplified samples (to the left) by CN. Y-axis, percentage EGFR amplification by FISH. Cut-off for amplification (≥ 15%) indicated by dotted horizontal line. N = 74 samples.
Figure 3.
Figure 3.. EGFR mRNA expression is highly associated with copy number (CN) determined by WES.
X-axis, geometric mean of EGFR copy number (all exons except exons 2-7); linear scale. Vertical dotted line at 3 delineates EGFR-amplified (to the right) vs –nonamplified samples (to the left) by CN. Y-axis, EGFR mRNA expression measured by RT-PCR (ΔCt); linear scale. Horizontal dotted line at −5.50 delineates cut-off between EGFR-positive (above line) and -negative (below line) samples. N = 74 samples.
Figure 4.
Figure 4.. EGFR expression by RNAseq and RT-PCR are comparable.
Correlation between RNAseq (x-axis, log2 scale; FPKM, fragments per kilobase million.) and RT-PCR (y-axis, ΔCt, linear scale) results in 64 tumor samples. Horizontal dotted line at −5.50 delineates cut-off between EGFR-positive (above line) and -negative (below line) samples. Colors indicate EGFR amplification as determined by FISH, symbol indicates EGFRvIII mutation (present +, absent •), with mutation detected exclusively among EGFR-amplified tumors.
Figure 5.
Figure 5.. Correlation of EGFR amplification with mRNA and protein expression.
A, EGFR mRNA expression measured by RT-PCR (ΔCt, linear scale). FISH and RT-PCR assays performed on 202 samples; 4 are excluded here (2 FISH failure, 1 FISH result unreadable, 1 RT-PCR failure). B, H-score for EGFR protein expression determined by IHC. Colors indicate EGFR amplification as determined by FISH. FISH and IHC assays performed on 34 samples; 1 sample with an H-score of 0 is excluded due to FISH failure. Error bars indicate range.

References

    1. Brennan CW, Verhaak RG, McKenna A, Campos B, Noushmehr H, Salama SR, et al. The somatic genomic landscape of glioblastoma. Cell 2013;155(2):462–77 doi 10.1016/j.cell.2013.09.034. - DOI - PMC - PubMed
    1. Gan HK, Cvrljevic AN, Johns TG. The epidermal growth factor receptor variant III (EGFRvIII): where wild things are altered. FEBS J 2013;280(21):5350–70 doi 10.1111/febs.12393. - DOI - PubMed
    1. Yoshimoto K, Dang J, Zhu S, Nathanson D, Huang T, Dumont R, et al. Development of a real-time RT-PCR assay for detecting EGFRvIII in glioblastoma samples. Clin Cancer Res 2008;14(2):488–93 doi 10.1158/1078-0432.CCR-07-1966. - DOI - PubMed
    1. van den Bent M, Roberts-Rapp LA, Ansell P, Lee J, Looman J, Bain E, et al. Epidermal growth factor receptor (EGFR) amplification rates observed in screening patients for randomized clinical trials in glioblastoma. Ann Oncol 2017;28(Suppl 5) doi 10.1093/annonc/mdx366.002. - DOI - PMC - PubMed
    1. Beroukhim R, Getz G, Nghiemphu L, Barretina J, Hsueh T, Linhart D, et al. Assessing the significance of chromosomal aberrations in cancer: methodology and application to glioma. Proc Natl Acad Sci U S A 2007;104(50):20007–12 doi 10.1073/pnas.0710052104. - DOI - PMC - PubMed

Publication types

Associated data