. 2019 Apr;29(4):602-612.
doi: 10.1101/gr.243832.118. Epub 2019 Feb 22.

Cohesin occupancy and composition at enhancers and promoters are linked to DNA replication origin proximity in Drosophila

Affiliations

Cohesin occupancy and composition at enhancers and promoters are linked to DNA replication origin proximity in Drosophila

Michelle Pherson et al. Genome Res. 2019 Apr.

Abstract

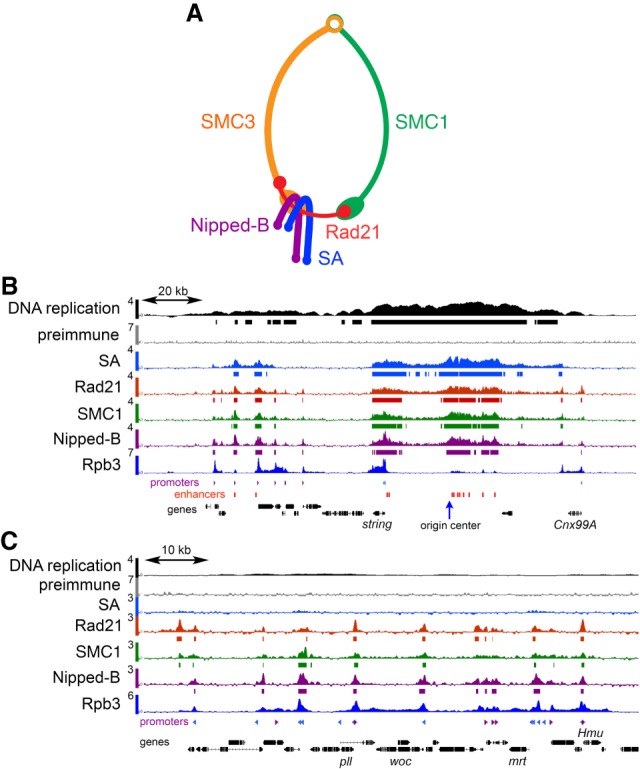
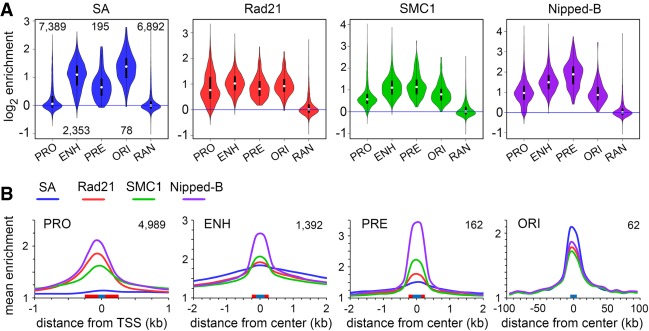
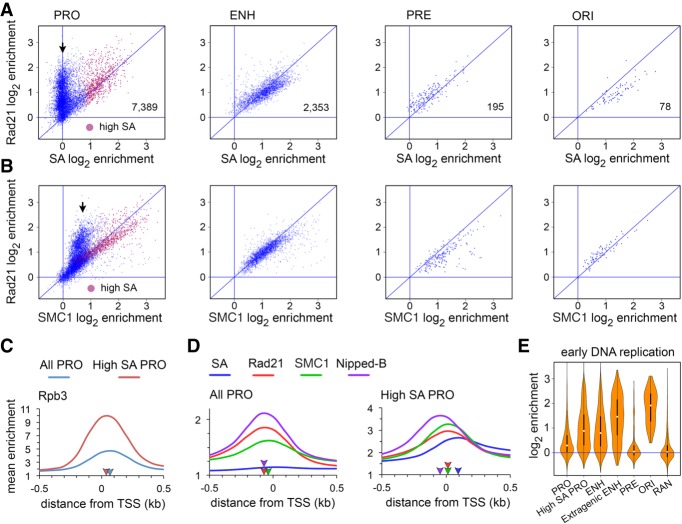
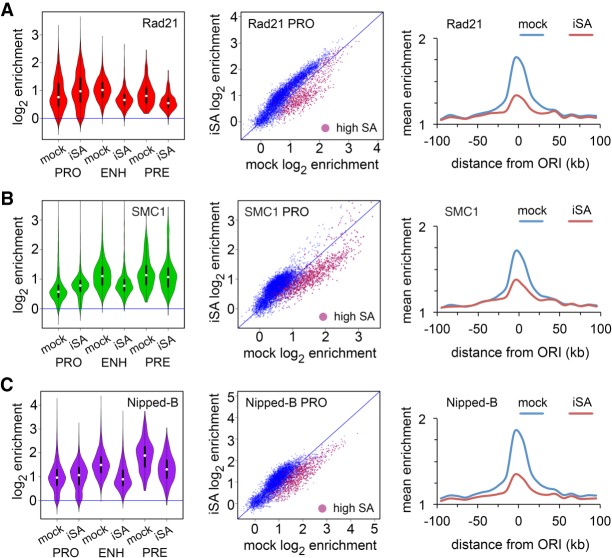
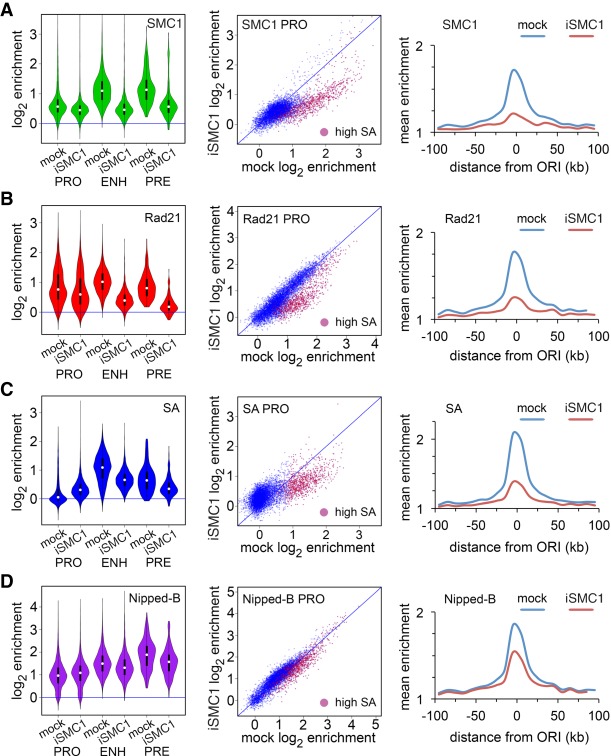
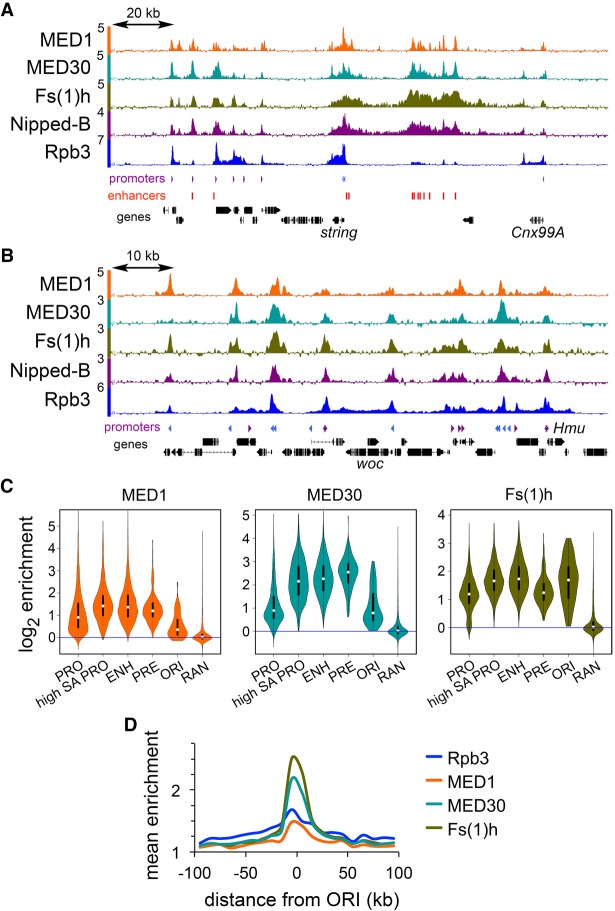
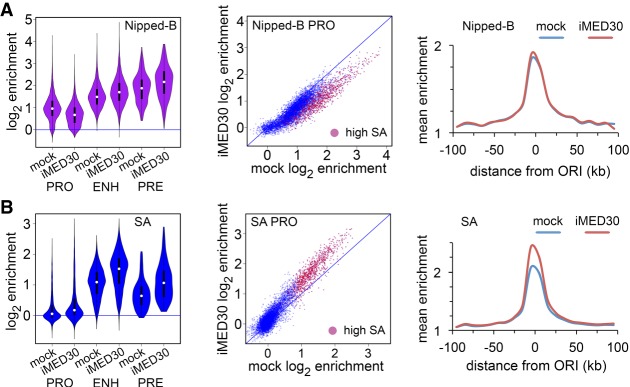
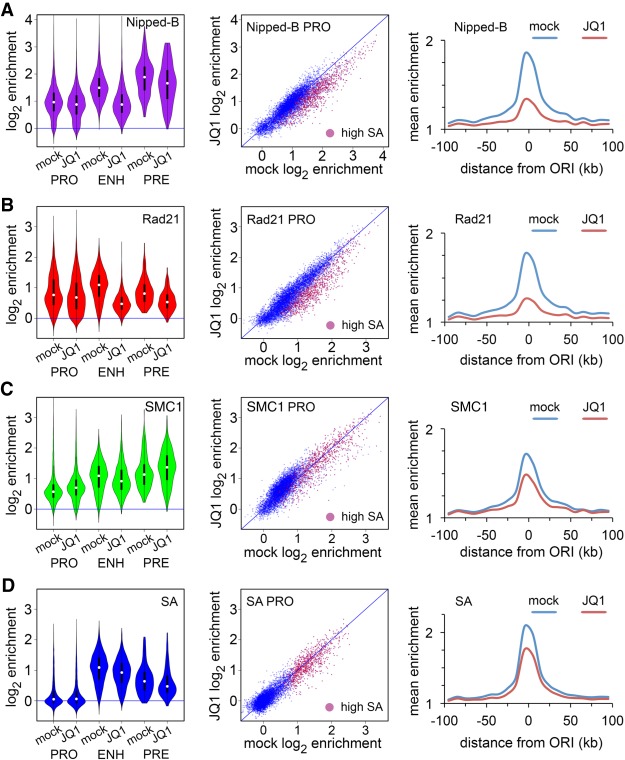
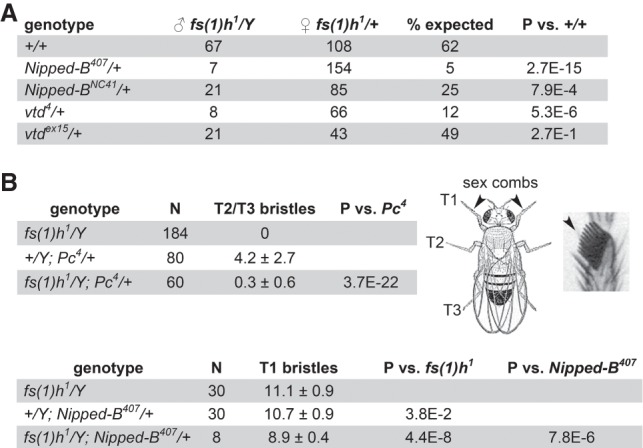
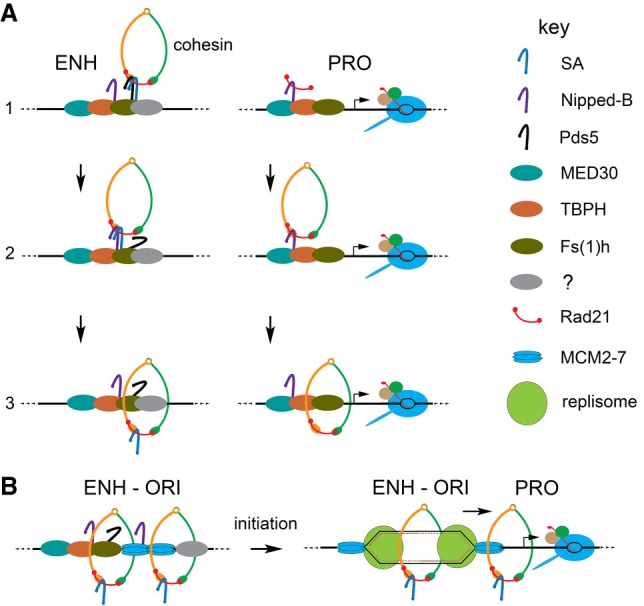
Cohesin consists of the SMC1-SMC3-Rad21 tripartite ring and the SA protein that interacts with Rad21. The Nipped-B protein loads cohesin topologically around chromosomes to mediate sister chromatid cohesion and facilitate long-range control of gene transcription. It is largely unknown how Nipped-B and cohesin associate specifically with gene promoters and transcriptional enhancers, or how sister chromatid cohesion is established. Here, we use genome-wide chromatin immunoprecipitation in Drosophila cells to show that SA and the Fs(1)h (BRD4) BET domain protein help recruit Nipped-B and cohesin to enhancers and DNA replication origins, whereas the MED30 subunit of the Mediator complex directs Nipped-B and Vtd in Drosophila (also known as Rad21) to promoters. All enhancers and their neighboring promoters are close to DNA replication origins and bind SA with proportional levels of cohesin subunits. Most promoters are far from origins and lack SA but bind Nipped-B and Rad21 with subproportional amounts of SMC1, indicating that they bind cohesin rings only part of the time. Genetic data show that Nipped-B and Rad21 function together with Fs(1)h to facilitate Drosophila development. These findings show that Nipped-B and cohesin are differentially targeted to enhancers and promoters, and suggest models for how SA and DNA replication help establish sister chromatid cohesion and facilitate enhancer-promoter communication. They indicate that SA is not an obligatory cohesin subunit but a factor that controls cohesin location on chromosomes.


Figures

Figure 1.
Figure 1.
Cohesin and Nipped-B ChIP-seq in BG3 cells. (A) Cohesin subunit structure. (B) ChIP-seq near an early DNA replication origin at the string (stg, also known as cdc25) gene. ChIP-seq and DNA replication data are plotted as log2 enrichment. Bars below each track indicate enrichment in the 95th percentile over regions ≥300 bp. RpII33 (also known as Rpb3) RNA polymerase II subunit data are from a prior publication (Pherson et al. 2017). Locations of promoters (purple and blue, forward and reverse) and enhancers (red) are indicated below the tracks. (C) ChIP-seq in a region distant from an early replication origin containing the woc (without children) gene.
Figure 2.
Figure 2.
Cohesin subunits are present in different ratios at promoters, enhancers, PREs, and replication origins in BG3 cells. (A) Violin plot distributions of SA (blue), Rad21 (red), SMC1 (green), and Nipped-B (purple) at active promoters (PRO), enhancers (ENH), Polycomb Response Elements (PRE), early replication origin centers (ORI), and randomly positioned sequences (RAN). The numbers of each type of feature analyzed are indicated in the SA plot. White dots are the median values given in Supplemental Table S2. (B) Meta-analyses of promoters, enhancers, PREs, and early replication origins for SA (blue), Rad21 (red), SMC1 (green), and Nipped-B (purple). Red boxes on the x-axes indicate the feature sizes used to calculate occupancy for the violin plots, and blue boxes indicate the bin sizes used to average enrichment for the meta-analysis. The numbers of each type of feature used for meta-analysis are indicated in the upper right corner of each graph. These are less than for the violin plots because features that overlap in the meta-analysis region were removed to minimize distortions.
Figure 3.
Figure 3.
Nipped-B, Rad21, and subproportional SMC1 occupy most active promoters without SA in BG3 cells. (A) Dot plots of SA versus Rad21 enrichment at promoters (PRO), enhancers (ENH), PREs (PRE), and origin centers (ORI). The numbers of each feature type are indicated in the plots. Promoters with high SA enrichment (95th percentile over regions ≥300 bp) are plotted in red. The black arrow indicates promoters with Rad21 but no SA. (B) Dot plots of SMC1 enrichment versus Rad21 enrichment at the indicated feature types. The black arrow indicates promoters with subproportional SMC1. (C) Rpb3 (Pol II) promoter meta-analysis for active promoters (blue) and the subset occupied by SA (high SA, red). Blue and red arrowheads on the x-axis indicate the positions of peak enrichment. (D) SA (blue), Rad21 (red), SMC1 (green), and Nipped-B (purple) promoter meta-analysis for all promoters (All PRO) and the subset occupied by SA (High SA PRO). The purple, red, green, and blue arrowheads on the x-axes indicate peak enrichment for Nipped-B, Rad21, SMC1, and SA. SA peak enrichment is indicated only for high SA promoters. (E) Violin plots showing enrichment of early replicating DNA for all active promoters (PRO), promoters occupied by SA (High SA PRO), enhancers (ENH), the subset of enhancers positioned at least 500 bp outside of a transcribed region (Extragenic ENH), PREs (PRE), centers of replication origins (ORI), and randomly positioned sequences (RAN).
Figure 4.
Figure 4.
SA targets Rad21, SMC1, and Nipped-B to enhancers and origin-proximal promoters in BG3 cells. An example of SA protein depletion is in Supplemental Figure S3A. (A) Effects of SA depletion (iSA) on Rad21 localization. Violin plots (left) show the distribution of Rad21 enrichment at promoters (PRO), enhancers (ENH), and PREs (PRE) in mock control cells and cells depleted for SA. Promoter dot plots (middle) show enrichment in mock control cells versus SA-depleted cells. High SA promoters are plotted in red. Origin meta-analysis (right) shows Rad21 distribution surrounding early replication origins in mock control cells (blue) and SA-depleted (iSA) cells (red). (B) Effects of SA depletion on SMC1 location. (C) Effects of SA depletion on Nipped-B localization. Median values for all occupancy distributions and Wilcoxon P-values for mock versus SA depletion are in Supplemental Table S2. All occupancy changes are statistically significant except for SMC1 at PREs.
Figure 5.
Figure 5.
SMC1 facilitates Rad21 and SA association with enhancers and origin-proximal promoters in BG3 cells. (A) SMC1 ChIP-seq of SMC1-depleted (iSMC1) cells. The violin plot distributions, promoter dot plots, and meta-analysis of early DNA replication origins show globally reduced SMC1 occupancy leaving similar residual levels at all features. (B) Effects of SMC1 depletion on Rad21 localization. (C) Effects of SMC1 depletion on SA localization. (D) Effects of SMC1 depletion on Nipped-B localization. All occupancy changes are statistically significant (Supplemental Table S2). ChIP-seq track examples are in Supplemental Figure S4.
Figure 6.
Figure 6.
The MED30 Mediator subunit and Fs(1)h BET domain protein colocalize with Nipped-B and are origin-centric in BG3 cells. (A) ChIP-seq for the indicated proteins in an origin-proximal region containing the string (cdc25) gene. (B) ChIP-seq for the indicated proteins in an origin-distal region containing the woc gene. (C) Violin plot distributions for MED1 (orange), MED30 (cyan), and Fs(1)h (olive) occupancy at all active promoters (PRO), SA-occupied promoters (high SA PRO), enhancers (ENH), PREs (PRE), centers of early DNA replication origins (ORI), and randomly positioned sequences (RAN). (D) Meta-origin analysis of Rpb3 (blue), MED1 (orange), MED30 (cyan), and Fs(1)h (olive) occupancy.
Figure 7.
Figure 7.
The MED30 Mediator subunit facilitates Nipped-B association with promoters in BG3 cells. An example of MED30 protein depletion is in Supplemental Figure S3A. (A) Effects of MED30 depletion (iMED30) on Nipped-B localization. (B) Effects of MED30 depletion on SA localization. All changes in Nipped-B and SA occupancy are statistically significant except at the centers of early origins (Supplemental Table S2).
Figure 8.
Figure 8.
The Fs(1)h BET domain protein promotes association of Nipped-B and Rad21 with enhancers and origin-proximal promoters. The effects of the JQ1 inhibitor on Fs(1)h binding and cell cycle are shown in Supplemental Figure S6. (A) Effects of JQ1 on Nipped-B occupancy. (B) Effects of JQ1 on Rad21 occupancy. (C) Effects of JQ1 on SMC1 occupancy. (D) Effects of JQ1 on SA occupancy. Effects of JQ1 on Nipped-B occupancy are statistically significant except at PREs (Supplemental Table S2). All effects on Rad21 occupancy are significant. Effects on SMC1 occupancy are significant except at high SA promoters. Changes in SA occupancy are significant except at promoters and PREs.
Figure 9.
Figure 9.
Nipped-B and Rad21 (vtd) mutations dominantly enhance fs(1)h1 mutant phenotypes. Crosses were conducted at 29°. (A) Nipped-B and Rad21 (vtd) mutations dominantly decrease fs(1)h1 male viability. The numbers of fs(1)h1/Y males with the indicated genotypes and their fs(1)h1/+ sisters recovered are given. The percentage expected is the male to female ratio. P-values were calculated using Fisher's exact test. (B) fs(1)h1 suppresses the ectopic T2 and T3 leg sex comb bristles in Pc4 mutant males and reduces the number of T1 sex comb bristles when combined with heterozygous Nipped-B407. The diagram shows a male fly indicating the T1, T2, and T3 legs and a magnified view of T1 sex comb bristles. The tables give the number of legs scored (N) with the average number of bristles per leg and the standard deviation. P-values were calculated using the t-test.
Figure 10.
Figure 10.
Theoretical models for cohesin recruitment and the roles of origins and DNA replication in sister chromatid cohesion and enhancer–promoter communication. (A) Cohesin recruitment to enhancers (ENH) and promoters (PRO). The factor key is on the right. At enhancers (left), we posit that Pds5 (black) and SA (blue) recruit tripartite cohesin rings (step 1) and that Nipped-B (purple) displaces Pds5 (step 2) to load cohesin topologically (step 3). SA association with enhancers is facilitated by Pds5 (Misulovin et al. 2018) and unknown enhancer-specific proteins (gray). At promoters (right), we envision that the MED30 Mediator subunit (cyan) and the TBPH protein (orange) (Swain et al. 2016) recruit Nipped-B and Rad21 (red) without SMC1-SMC3 dimers or SA (step 1). At some frequency, Nipped-B–Rad21 complexes capture SMC1-SMC3 dimers (step 2) and SA-deficient cohesin is loaded (step 3). (B) We theorize that enhancers capture translocating MCM2-7 helicase complexes (Powell et al. 2015) to position early replication origins (left). DNA unwinding by MCM2-7 upon initiation of replication topologically captures both single-stranded templates within cohesin rings behind the nascent forks to establish sister chromatid cohesion (right). Replication forks push other SA-containing cohesin rings to be captured by neighboring promoters, facilitating enhancer–promoter communication (right).

Similar articles

Cited by

References

    1. Allen BL, Taatjes DJ. 2015. The Mediator complex: a central integrator of transcription. Nat Rev Mol Cell Biol 16: 155–166. 10.1038/nrm3951 - DOI - PMC - PubMed
    1. Beckouët F, Srinivasan M, Roig MB, Chan KL, Scheinost JC, Batty P, Hu B, Petela N, Gligoris T, Smith AC, et al. 2016. Releasing activity disengages cohesin's Smc3/Scc1 interface in a process blocked by acetylation. Mol Cell 61: 563–574. 10.1016/j.molcel.2016.01.026 - DOI - PMC - PubMed
    1. Brough R, Bajrami I, Vatcheva R, Natrajan R, Reis-Filho JS, Lord CJ, Ashworth A. 2012. APRIN is a cell cycle specific BRCA2-interacting protein required for genome integrity and a predictor of outcome after chemotherapy in breast cancer. EMBO J 31: 1160–1176. 10.1038/emboj.2011.490 - DOI - PMC - PubMed
    1. Çamdere G, Guacci V, Stricklin J, Koshland D. 2015. The ATPases of cohesin interface with regulators to modulate cohesin-mediated DNA tethering. eLife 4: e11315 10.7554/eLife.11315 - DOI - PMC - PubMed
    1. Countryman P, Fan Y, Gorthi A, Pan H, Strickland J, Kaur P, Wang X, Lin J, Lei X, White C, et al. 2018. Cohesin SA2 is a sequence-independent DNA-binding protein that recognizes DNA replication and repair intermediates. J Biol Chem 293: 1054–1069. 10.1074/jbc.M117.806406 - DOI - PMC - PubMed

Publication types