

Unraveling the hidden universe of small proteins in bacterial genomes
- PMID: 30796087
- PMCID: PMC6385055
- DOI: 10.15252/msb.20188290
Unraveling the hidden universe of small proteins in bacterial genomes
Abstract
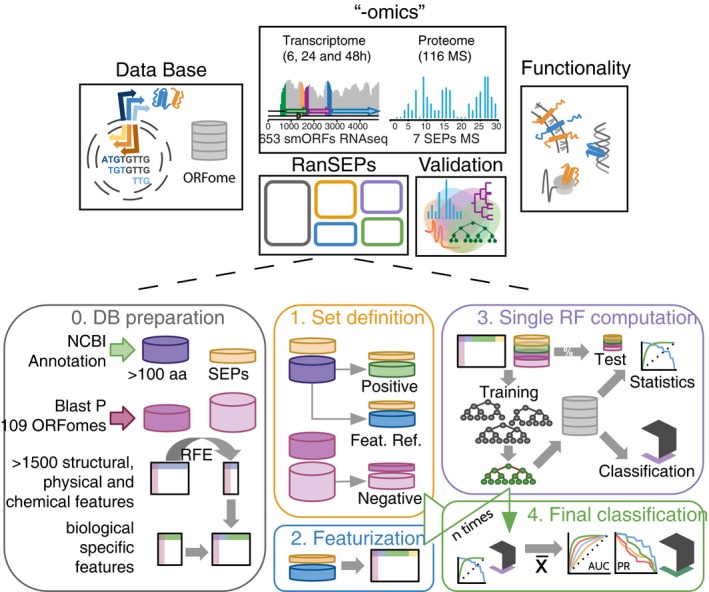
Identification of small open reading frames (smORFs) encoding small proteins (≤ 100 amino acids; SEPs) is a challenge in the fields of genome annotation and protein discovery. Here, by combining a novel bioinformatics tool (RanSEPs) with "-omics" approaches, we were able to describe 109 bacterial small ORFomes. Predictions were first validated by performing an exhaustive search of SEPs present in Mycoplasma pneumoniae proteome via mass spectrometry, which illustrated the limitations of shotgun approaches. Then, RanSEPs predictions were validated and compared with other tools using proteomic datasets from different bacterial species and SEPs from the literature. We found that up to 16 ± 9% of proteins in an organism could be classified as SEPs. Integration of RanSEPs predictions with transcriptomics data showed that some annotated non-coding RNAs could in fact encode for SEPs. A functional study of SEPs highlighted an enrichment in the membrane, translation, metabolism, and nucleotide-binding categories. Additionally, 9.7% of the SEPs included a N-terminus predicted signal peptide. We envision RanSEPs as a tool to unmask the hidden universe of small bacterial proteins.
Keywords: mass spectroscopy; mycoplasmas; protein prediction; random forest classifier; small proteins.
© 2019 The Authors. Published under the terms of the CC BY 4.0 license.
Conflict of interest statement
The authors declare that they have no conflict of interest.
Figures
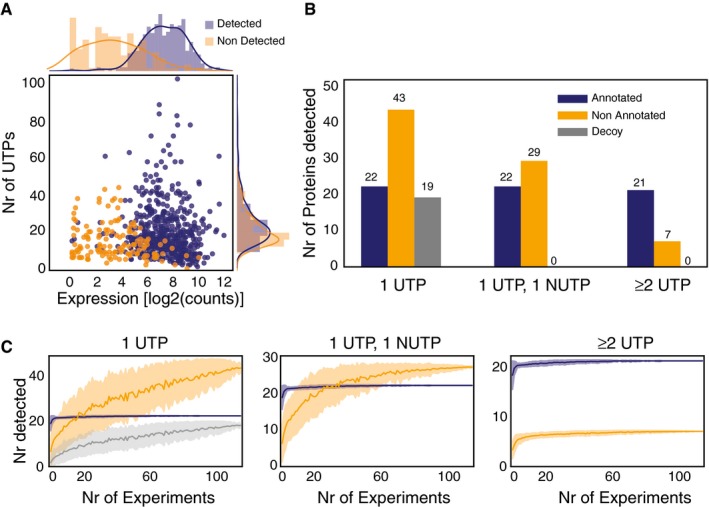
Evaluation of expression by RNA‐Seq and number of peptides required to detect an annotated protein by MS in M. pneumoniae. The plot represents the relationship between expression levels (average expression from RNA‐Seq data) and number of possible unique tryptic peptides (UTPs) for two sets of studied proteins: detected (blue dots) and not detected (orange dots) by MS.
Evaluation of thresholds and artefactual signals in MS data. The histogram represents the total number of SEP proteins detected in 116 shotgun MS experiments with 1 UTP, 1 UTP and 1 NUTP, or ≥ 2 UTPs for three categories. Color code: annotated (blue bars), putative new (orange bars), and decoy set (gray bars).
Number of SEPs detected by increasing the number of experiments. Color code is the same as in panel (B). Each line represents the accumulated number of different SEPs detected (y‐axis) when combining 1–116 MS datasets (x‐axis) from M. pneumoniae. Each line has an associated error that is shaded and represents the standard deviation within combinations of datasets (e.g., x = 80 will present the average number of proteins detected taking every combination of datasets in groups of 80 samples).
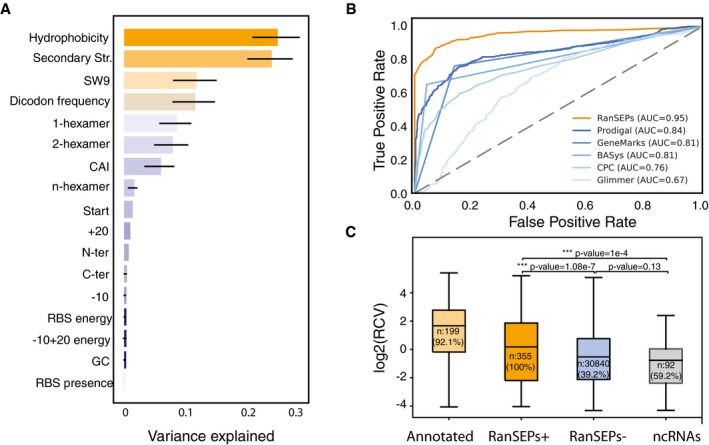
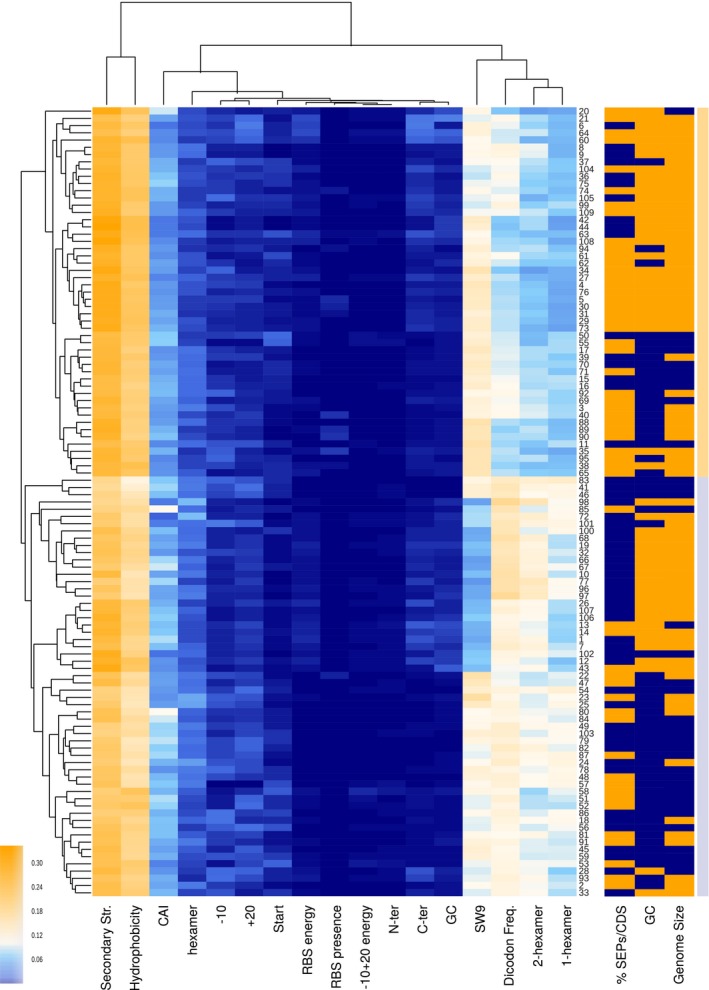
Feature weight prediction in M. pneumoniae. Weights of the different features considered in the classification by RanSEPs. Bars indicate the global averaged variance that each feature explains by itself along with its associated standard deviation (black line) (25 iterations to estimate the error).
Method accuracy comparative. Receiver operating characteristic curve for RanSEPs (orange) and five additional tools (blue gradient). The closer a curve to the left‐hand border, the more accurate the tool. The area under the curve (AUC) associated with each method is presented, with values closer to 1 indicating a more accurate method. The dashed gray line represents a classifier that assigns the coding class randomly.
Boxplot representing the relationship between RanSEPs‐positive (“RanSEPs+”, score ≥ 0.5) and RanSEPs‐negative (“RanSEPs−”, score < 0.5) SEPs predictions and associated RCV (ribosome profiling ratio coverage, in log2) in Escherichia coli. Only annotations ≤ 300 nucleotides in length were included. As positive and negative controls, we considered annotated SEPs (“Annotated”) and non‐coding RNAs (“ncRNAs”), respectively. Annotations within RanSEPs+, RanSEPs−, and ncRNAs overlapping with known annotated genes were excluded. Annotations with RCV = 0.0 are filtered out, and the number within the box represents the percentage of values in that class that are kept in the comparative. Along the top, P‐values computed by Mann–Whitney rank test are indicated.
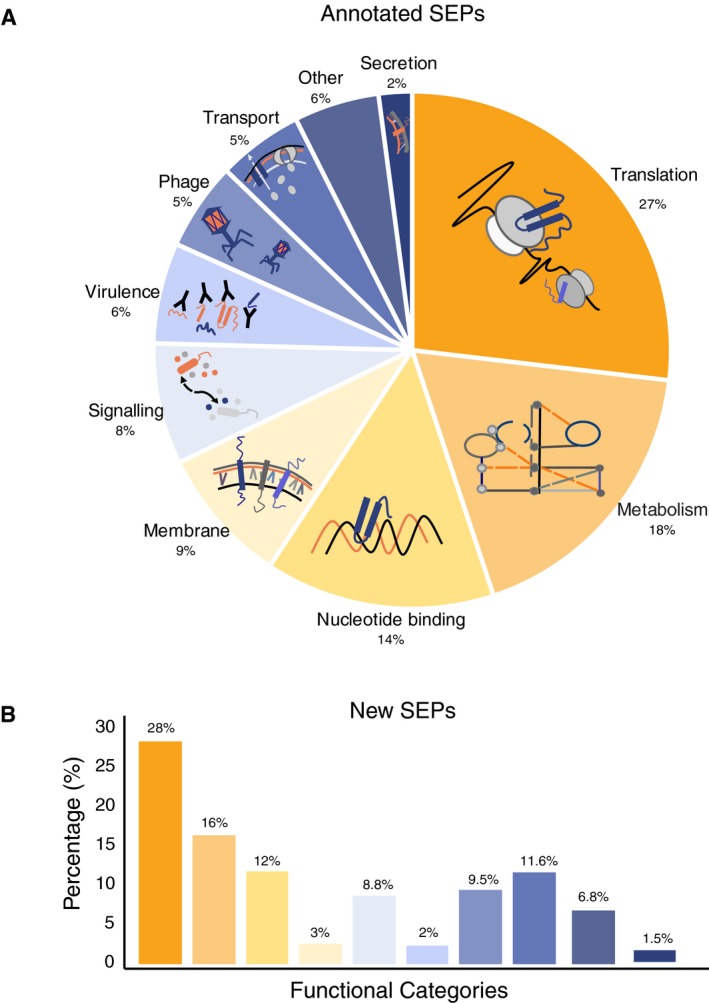
Landscape of the SEPs with functional annotations in NCBI considering 109 bacterial genomes (Number of SEPs = 25,229 SEPs).
Functional inference of the predicted SEPs (N = 11,238) as determined using BLASTP against NCBI‐annotated SEPs having an associated function (N = 5,175). The color code associated with each category is the same as in panel (A).
References
Publication types
MeSH terms
Substances
LinkOut - more resources
Full Text Sources
Molecular Biology Databases
