Antidepressants are modifiers of lipid bilayer properties
- PMID: 30796095
- PMCID: PMC6400527
- DOI: 10.1085/jgp.201812263
Antidepressants are modifiers of lipid bilayer properties
Abstract
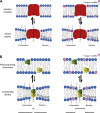
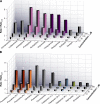
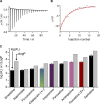
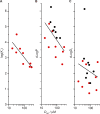
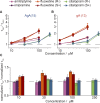
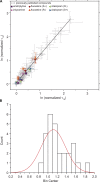
The two major classes of antidepressants, tricyclic antidepressants (TCAs) and selective serotonin reuptake inhibitors (SSRIs), inhibit neurotransmitter reuptake at synapses. They also have off-target effects on proteins other than neurotransmitter transporters, which may contribute to both desired changes in brain function and the development of side effects. Many proteins modulated by antidepressants are bilayer spanning and coupled to the bilayer through hydrophobic interactions such that the conformational changes underlying their function will perturb the surrounding lipid bilayer, with an energetic cost (ΔG def) that varies with changes in bilayer properties. Here, we test whether changes in ΔG def caused by amphiphilic antidepressants partitioning into the bilayer are sufficient to alter membrane protein function. Using gramicidin A (gA) channels to probe whether TCAs and SSRIs alter the bilayer contribution to the free energy difference for the gramicidin monomer⇔dimer equilibrium (representing a well-defined conformational transition), we find that antidepressants alter gA channel activity with varying potency and no stereospecificity but with different effects on bilayer elasticity and intrinsic curvature. Measuring the antidepressant partition coefficients using isothermal titration calorimetry (ITC) or cLogP shows that the bilayer-modifying potency is predicted quite well by the ITC-determined partition coefficients, and channel activity is doubled at an antidepressant/lipid mole ratio of 0.02-0.07. These results suggest a mechanism by which antidepressants could alter the function of diverse membrane proteins by partitioning into cell membranes and thereby altering the bilayer contribution to the energetics of membrane protein conformational changes.
© 2019 Kapoor et al.
Figures


Similar articles
-
Intrinsic Lipid Curvature and Bilayer Elasticity as Regulators of Channel Function: A Comparative Single-Molecule Study.Int J Mol Sci. 2024 Feb 27;25(5):2758. doi: 10.3390/ijms25052758. Int J Mol Sci. 2024. PMID: 38474005 Free PMC article.
-
Thiazolidinedione insulin sensitizers alter lipid bilayer properties and voltage-dependent sodium channel function: implications for drug discovery.J Gen Physiol. 2011 Aug;138(2):249-70. doi: 10.1085/jgp.201010529. J Gen Physiol. 2011. PMID: 21788612 Free PMC article.
-
Regulation of sodium channel function by bilayer elasticity: the importance of hydrophobic coupling. Effects of Micelle-forming amphiphiles and cholesterol.J Gen Physiol. 2004 May;123(5):599-621. doi: 10.1085/jgp.200308996. J Gen Physiol. 2004. PMID: 15111647 Free PMC article.
-
Single-molecule methods for monitoring changes in bilayer elastic properties.Methods Mol Biol. 2007;400:543-70. doi: 10.1007/978-1-59745-519-0_37. Methods Mol Biol. 2007. PMID: 17951759 Review.
-
Bilayer thickness and membrane protein function: an energetic perspective.Annu Rev Biophys Biomol Struct. 2007;36:107-30. doi: 10.1146/annurev.biophys.36.040306.132643. Annu Rev Biophys Biomol Struct. 2007. PMID: 17263662 Review.
Cited by
-
Intrinsic Lipid Curvature and Bilayer Elasticity as Regulators of Channel Function: A Comparative Single-Molecule Study.Int J Mol Sci. 2024 Feb 27;25(5):2758. doi: 10.3390/ijms25052758. Int J Mol Sci. 2024. PMID: 38474005 Free PMC article.
-
A heterotrimeric G protein (Gsα) biomarker may predict antidepressant response in subjects with major depressive disorder.Front Psychiatry. 2025 Jul 18;16:1619243. doi: 10.3389/fpsyt.2025.1619243. eCollection 2025. Front Psychiatry. 2025. PMID: 40756308 Free PMC article.
-
Antidepressants enter cells, organelles, and membranes.Neuropsychopharmacology. 2024 Jan;49(1):246-261. doi: 10.1038/s41386-023-01725-x. Epub 2023 Oct 2. Neuropsychopharmacology. 2024. PMID: 37783840 Free PMC article. Review.
-
A novel peripheral biomarker for depression and antidepressant response.Mol Psychiatry. 2022 Mar;27(3):1640-1646. doi: 10.1038/s41380-021-01399-1. Epub 2022 Jan 5. Mol Psychiatry. 2022. PMID: 34969978 Free PMC article.
-
Low-Dose Fluvoxamine Modulates Endocytic Trafficking of SARS-CoV-2 Spike Protein: A Potential Mechanism for Anti-COVID-19 Protection by Antidepressants.Front Pharmacol. 2021 Dec 16;12:787261. doi: 10.3389/fphar.2021.787261. eCollection 2021. Front Pharmacol. 2021. PMID: 34975483 Free PMC article.
References
-
- ACD/Percepta PhysChem Suite 2012. ACD/Percepta PhysChem Suite. Available at: https://www.acdlabs.com/products/percepta/ (accessed December 19, 2018).
-
- Andersen O.S., Sawyer D.B., and Koeppe R.E. II. 1992. Modulation of channel function by the host bilayer. In Biomembrane Structure and Function: The State of the Art. Gaber B.P., and Easwaran K.R.K., editors. Adenine Press, Schenectady, NY: 227–244.
-
- Avdeef A. 2001. Physicochemical profiling (solubility, permeability and charge state). Curr. Top. Med. Chem. 1:277–351. - PubMed
-
- Aveyard R., and Haydon D.A.. 1973. An Introduction to the Principles of Surface Chemistry. Cambridge University Press, London.
Publication types
MeSH terms
Substances
Grants and funding
LinkOut - more resources
Full Text Sources

