. 2019 Mar 26;132(6):jcs220970.
doi: 10.1242/jcs.220970.

PML is recruited to heterochromatin during S phase and represses DAXX-mediated histone H3.3 chromatin assembly

Affiliations

PML is recruited to heterochromatin during S phase and represses DAXX-mediated histone H3.3 chromatin assembly

Prashanth Krishna Shastrula et al. J Cell Sci. .

Abstract

The incorporation of the histone H3 variant, H3.3, into chromatin by the H3.3-specific chaperone DAXX and the ATP-dependent chromatin remodeling factor ATRX is a critical mechanism for silencing repetitive DNA. DAXX and ATRX are also components of promyelocytic nuclear bodies (PML-NBs), which have been identified as sites of H3.3 chromatin assembly. Here, we use a transgene array that can be visualized in single living cells to investigate the mechanisms that recruit PML-NB proteins (i.e. PML, DAXX, ATRX, and SUMO-1, SUMO-2 and SUMO-3) to heterochromatin and their functions in H3.3 chromatin assembly. We show that DAXX and PML are recruited to the array through distinct SUMOylation-dependent mechanisms. Additionally, PML is recruited during S phase and its depletion increases H3.3 deposition. Since this effect is abrogated when PML and DAXX are co-depleted, it is likely that PML represses DAXX-mediated H3.3 chromatin assembly. Taken together, these results suggest that, at heterochromatin, PML-NBs coordinate H3.3 chromatin assembly with DNA replication, which has important implications for understanding how transcriptional silencing is established and maintained.

Keywords: ATRX; DAXX; Histone H3.3; PML; PML nuclear body; SUMOylation.


Conflict of interest statement

Competing interestsThe authors declare no competing or financial interests.

Figures

Fig. 1.
Fig. 1.
SUMO-1, SUMO-2/3 and PML form rings around the transgene array. (A) Single confocal images of SUMO-1 (red; panels a and d) and SUMO-2/3 (red; panels g and j) immunofluorescence staining in HeLa HI 1-1 cells. Merge images show the overlap of the SUMO proteins with YFP–lac repressor (green), which marks the transgene array, and DAPI DNA staining (blue) (panels b, e, h and k). Arrows indicate the array. Insets show cropped enlarged images of the array. White lines in the merge insets show the path through which the green and red signals were measured in the intensity profiles (panels c, f, i and l). Asterisks mark the start of the measured line. Scale bars: 5 µm (main image panel a); 1 µm (inset). (B) Single confocal images of SUMO-1 (green; panel a) and PML (red; panel b) co-staining in HeLa HI 1-1 cells. The transgene array is marked by the CFP–lac repressor (blue). The white line in the merge inset shows the path through which the green, red and blue signals were measured in the intensity profile (panel d).
Fig. 2.
Fig. 2.
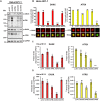
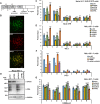
UBC9 is required for the PML, SUMO-1 and SUMO-2/3 transgene array rings to form. (A) Immunoblots of UBC9, PML, monomeric SUMO-1 and monomeric SUMO-2/3 in HeLa HI 1-1 cells following UBC9 (shUBC9) and PML (shPML) knockdowns. pLKO is a non-silencing control and GAPDH is used as a loading control. (B) Graphs of the percentages of asynchronously growing HeLa HI 1-1 cells with PML, SUMO-1, and SUMO-2/3 enrichment at the transgene array. For each bar in the graph, 50 cells were evaluated in four biological replicates and percentages were averaged. Results are presented as mean±s.d. **P≤0.01; ***P≤0.001; ns, not significant, P>0.05 [comparing UI (uninfected non-silencing control) to pLKO (non-silencing control), shPML and shUBC9 infected cells with an unpaired t-test]. Below the graphs, single confocal images of the proteins (red) and their merge with the transgene array, marked by the YFP–lac repressor (green), show representative localization patterns in knockdown cells. Scale bars: 1 µm. Intensity profiles for these images are shown in Fig. S2. (C) Quantitative analysis of protein levels in knockdown cells as detected by immunoblotting. Three biological replicates (n=3) with two technical replicates were analyzed for each. (D) Quantitative RT-PCR analysis of mRNA levels in knockdown cells. Three biological replicates (n=3) with two technical replicates for each were analyzed. Results are presented as mean±s.d. *P<0.05; **P≤0.01; ***P≤0.001; ns, not significant, P>0.05 [comparing pLKO (non-silencing control) to shPML and shUBC9 infected cells with an unpaired t-test].
Fig. 3.
Fig. 3.
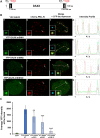
UBC9 is required for DAXX to be recruited to the transgene array. (A) Immunoblots of UBC9, PML, DAXX and ATRX in HeLa HI 1-1 cells following the indicated shRNA-mediated knockdowns. pLKO is a non-silencing control and GAPDH is used as a loading control. (B) Graphs of the percentages of asynchronously growing HeLa HI 1-1 cells with DAXX and ATRX enrichment at the transgene array. For each bar in the graph, 50 cells were evaluated in four biological replicates and percentages were averaged. Results are presented as mean±s.d. ***P≤0.001; ns, not significant, P>0.05 [comparing UI (uninfected non-silencing control) to pLKO (non-silencing control), shPML and shUBC9 infected cells with an unpaired t-test]. Below the graphs, single confocal images of the proteins (red) and their merge with the transgene array, marked by YFP-lac repressor (green), show representative localization patterns in knockdown cells. Scale bar: 1 µm. Intensity profiles for these images are shown in Fig. S4. (C) Quantitative analysis of protein levels in knockdown cells as detected by immunoblotting. Three biological replicates (n=3) with two technical replicates were analyzed for each. (D) qPCR analysis of mRNA levels in knockdown cells. Three biological replicates (n=3) with two technical replicates for each were analyzed. Results are presented as mean±s.d. *P<0.05; **P≤0.01; ***P≤0.001; ns, not significant, P>0.05 (comparing pLKO to knockdown cells with an unpaired t-test).
Fig. 4.
Fig. 4.
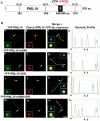
The DAXX SIM domains regulate its recruitment to the transgene array. (A) Diagram of DAXX showing the location of the SIMs and the mutations. (B) Single confocal images of YFP–DAXX, YFP–DAXX-mSIM1, YFP–DAXX-mSIM2 and YFP–DAXX-mSIM1/2 co-expressed in HeLa HI 1-1 cells with Cherry–PML-IV and CFP–lac repressor, which was used to mark the transgene array. Arrows indicate the array. Insets show enlarged images of the YFP–DAXX (green), Cherry–PML-IV (red) or CFP–lac repressor (blue) signals, and the merge at the array. White lines in the merge images show the path through which the green, red and blue signals were measured in the intensity profiles (panels d, h, l and p). Asterisks mark the start of the measured line. Scale bars: 5 µm (main image, panel o); 1 µm (inset). (C) Quantitative image analysis of the average intensity of YFP (n=9), YFP–DAXX (n=12), YFP–DAXX-mSIM1 (n=14), YFP–DAXX-mSIM2 (n=8) and YFP–DAXX-mSIM1/2 (n=8) levels at the transgene array. Results are presented as mean±s.d. **P≤0.01; ***P≤0.001 (comparing wild-type DAXX to the mutants with an unpaired t-test).
Fig. 5.
Fig. 5.
PML SIM and SUMOylation sites are not required for transgene array recruitment. (A) Diagram of PML-IV showing the location of the SIM and SUMOylation site mutations. (B) Single confocal images of YFP–PML-IV, YFP–PML-IV-mSIM, YFP–PML-IV-3KR and YFP–PML-IV-mSIM-3KR co-expressed in HeLa HI 1-1 cells with Cherry–PML-IV and CFP–lac repressor, which marks the transgene array. Arrows indicate the array. Insets show cropped enlarged images of the YFP–PML-IV constructs (green), Cherry–PML-IV (red) and CFP–lac repressor (blue) and their merge at the array. White lines in the merge show the path through which the green, red and blue signals were measured in the intensity profiles (panels d, h, l and p). Asterisks mark the start of the measured line. Scale bars: 5 µm (main image, panel o); 1 μm (inset).
Fig. 6.
Fig. 6.
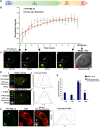
PML is recruited to the transgene array during S phase. (A) Diagram of the cell cycle phase timing in HeLa HI 1-1/PML-IV cells. (B) Quantification of the changes in YFP–PML-IV (green) and Cherry–lac repressor (red) intensity at the transgene array in HeLa HI 1-1/YFP-PML IV cells over time. Image stacks were collected every 30 min and analyzed up to the onset of metaphase (M). YFP–PML-IV and Cherry–lac repressor intensity levels at the array were averaged for each time point (n=10). Error bars represent the standard deviation (s.d.). Second-order polynomial trendlines were determined using Microsoft Excel. (C) Maximum projections of confocal image stacks of YFP–PML IV (green) and Cherry–lac repressor (red) (panels a–d) from Movie 6. Panel e is a maximum projection of the green and red confocal images with the differential interference contrast (DIC) images to show the metaphase cell. Arrows indicate the array. Insets show enlarged images of the array. Scale bars: 5 µm (main image, panel e); 1 µm (inset, panel d). (D) Merge of single confocal images of SUMO-1 immunofluorescence staining (red), YFP–PCNA (green) and CFP–lac repressor (blue) (panels a and c) in synchronized HeLa HI 1-1 cells (i.e. arrested at G1/S and 7 h after being released from G1/S). Arrows indicate the array. Insets are enlarged images of the array. White lines in merge images show the path through which the green, red and blue signals were measured in the intensity profiles (panels b and d). Asterisks mark the start of the measured line. Scale bars: 5 µm (main image, panel c); 1 µm (inset). (E) Graphs of the coincidence of the SUMO-1 transgene array rings with PCNA enrichment at the transgene array and in a replication pattern in the nucleus in synchronized cells (i.e. G1/S; S phase, 2 h.; S phase, 7 h.; and G2/M). For each bar in the graph, 50 cells were evaluated in three biological replicates and percentages were averaged. Results are presented as mean±s.d. *P<0.05; ***P≤0.001; ns, not significant, P>0.05 (comparing G1/S arrested cells to the other time points with an unpaired t-test). (F) Single confocal images and intensity profiles of EdU labeling (red), and YFP–PML-IV (green) and CFP-lac repressor (blue) in HeLa HI 1-1 cells presented as in D.
Fig. 7.
Fig. 7.
PML represses DAXX-mediated H3.3-chromatin assembly. (A) Diagram of the transgene and location of the primer pairs used for real-time qPCR analysis of ChIP samples. (B) Epifluorescence images of a metaphase spread of H3.3–YFP (green) and DAPI (pseudo-colored red) HI 1-1/H3.3-YFP cells. Scale bar: 10 µm. (C) Graph of H3.3–YFP levels at the transgene array following knockdowns in HeLa HI 1-1/H3.3-YFP cells detected using native ChIP with an anti-GFP antibody. Three biological replicates (n=3) with two technical replicates for each were analyzed. (D) Graph of H3.3 levels at the transgene array following knockdowns in HeLa HI 1-1 cells using cross-linked ChIP with H3.3-specific antibody. (E) Immunoblot of PML and DAXX levels in HeLa HI 1-1 cells following PML (shPML), DAXX (shDAXX) and PML/DAXX co-depletion. pLKO is a non-silencing shRNA control and GAPDH is used as a loading control. (F) Graph of H3.3 levels at the transgene array following PML and DAXX knockdowns in HeLa HI 1-1cells using cross-linked ChIP with H3.3-specific antibody. (G) Graph of H3K9me3 levels at the transgene array following knockdowns in HeLa HI 1-1cells using cross-linked ChIP with H3K9me3-specific antibody. Results are presented as mean±s.d. *P<0.05; **P≤0.01; ***P≤0.001; ns, not significant, P>0.05 [comparing control (pLKO) to knockdowns using unpaired t-test].
Fig. 8.
Fig. 8.
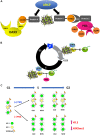
Models depicting mechanisms through which DAXX and PML are recruited to heterochromatin and how they regulate H3.3 chromatin assembly and epigenetic inheritance. (A) DAXX and PML are recruited to the transgene array through distinct SUMOylation-dependent mechanisms. (B) Model for how PML is recruited to the transgene array during S phase to repress DAXX-mediated H3.3 chromatin assembly. (C) Model for how PML represses DAXX-mediated H3.3 deposition and maintains H3K9me3 during replication-coupled chromatin assembly.

Similar articles

Cited by

References

    1. Bagheri-Fam S., Argentaro A., Svingen T., Combes A. N., Sinclair A. H., Koopman P. and Harley V. R. (2011). Defective survival of proliferating Sertoli cells and androgen receptor function in a mouse model of the ATR-X syndrome. Hum. Mol. Genet. 20, 2213-2224. 10.1093/hmg/ddr109 - DOI - PubMed
    1. Banaszynski L. A., Wen D., Dewell S., Whitcomb S. J., Lin M., Diaz N., Elsässer S. J., Chapgier A., Goldberg A. D., Canaani E. et al. (2013). Hira-dependent histone H3.3 deposition facilitates PRC2 recruitment at developmental loci in ES cells. Cell 155, 107-120. 10.1016/j.cell.2013.08.061 - DOI - PMC - PubMed
    1. Bernier-Villamor V., Sampson D. A., Matunis M. J. and Lima C. D. (2002). Structural basis for E2-mediated SUMO conjugation revealed by a complex between ubiquitin-conjugating enzyme Ubc9 and RanGAP1. Cell 108, 345-356. 10.1016/S0092-8674(02)00630-X - DOI - PubMed
    1. Bérubé N. G., Mangelsdorf M., Jagla M., Vanderluit J., Garrick D., Gibbons R. J., Higgs D. R., Slack R. S. and Picketts D. J. (2005). The chromatin-remodeling protein ATRX is critical for neuronal survival during corticogenesis. J. Clin. Invest. 115, 258-267. 10.1172/JCI200522329 - DOI - PMC - PubMed
    1. Boutell C., Orr A. and Everett R. D. (2003). PML residue lysine 160 is required for the degradation of PML induced by herpes simplex virus type 1 regulatory protein ICP0. J. Virol. 77, 8686-8694. 10.1128/JVI.77.16.8686-8694.2003 - DOI - PMC - PubMed

Publication types