. 2019 Mar 12;116(11):5144-5153.
doi: 10.1073/pnas.1817781116. Epub 2019 Feb 22.

Elementary response triggered by transducin in retinal rods

Affiliations

Elementary response triggered by transducin in retinal rods

Wendy W S Yue et al. Proc Natl Acad Sci U S A. .

Abstract

G protein-coupled receptor (GPCR) signaling is crucial for many physiological processes. A signature of such pathways is high amplification, a concept originating from retinal rod phototransduction, whereby one photoactivated rhodopsin molecule (Rho*) was long reported to activate several hundred transducins (GT*s), each then activating a cGMP-phosphodiesterase catalytic subunit (GT*·PDE*). This high gain at the Rho*-to-GT* step has been challenged more recently, but estimates remain dispersed and rely on some nonintact rod measurements. With two independent approaches, one with an extremely inefficient mutant rhodopsin and the other with WT bleached rhodopsin, which has exceedingly weak constitutive activity in darkness, we obtained an estimate for the electrical effect from a single GT*·PDE* molecular complex in intact mouse rods. Comparing the single-GT*·PDE* effect to the WT single-photon response, both in Gcaps-/- background, gives an effective gain of only ∼12-14 GT*·PDE*s produced per Rho*. Our findings have finally dispelled the entrenched concept of very high gain at the receptor-to-G protein/effector step in GPCR systems.

Keywords: G protein-coupled receptor; apo-opsin; rhodopsin; rod phototransduction; signal amplification.


Conflict of interest statement

The authors declare no conflict of interest.

Figures

Fig. 1.
Fig. 1.
Characterization of RhoREY/REY;Gcaps/ retinae and heterologously expressed REY-Rho. (A) Paraffin sections of 2-mo-old WT (Left) and REY (Right) retinae stained by H&E. (B) Paraffin sections of 2-mo-old WT (Top) and REY (Bottom) retinae immunostained for rhodopsin. DAPI marks the outer nuclear layer. (C) Extinction coefficients of WT-Rho (solid black trace) and REY-Rho (solid gray trace) measured by in vitro spectrophotometry. Acid denaturation (dashed traces; SI Appendix, Supplementary Methods) confirmed that both pigments were present at the same amount. Two other experiments gave similar measurements for REY-Rho. (D) Absorption spectra of WT (Top) and REY (Bottom) rods measured by in situ microspectrophotometry (SI Appendix, Supplementary Methods; mean ± SD; n = 8). (E) Western blots showing the expression levels of various phototransduction components in extracts of WT (Left) and REY (Right) retinae. ARR1, arrestin isoform 1; CNGA1 and CNGB1, A1 and B1 subunit of the rod CNG channel, respectively; GRK1, G protein receptor kinase isoform 1; GTα, GTβ, and GTγ, α, β, and γ subunit of GT, respectively; PDE6, rod phosphodiesterase isoform 6; RetGC1, retinal guanylate cyclase isoform 1; RGS9, regulator of G protein signaling isoform 9. GAPDH was used as control for protein concentration in total extracts.
Fig. 2.
Fig. 2.
Photoresponses of REY rods. (A) Response families of a WT rod (Left) and a REY rod (Right), both in Gcaps/ background. WT was exposed to 500-nm light; REY to white light because of its weak sensitivity. Averaged responses to 10-ms flashes at time 0 are shown. (B) Superimposed responses of a hOpn1lwTg;RhoREY/REY;Gcaps/ rod (red) and a REY rod (gray) to flashes of the same set of intensities at 560 nm (λmax of transgenic red cone pigment). Averaged responses to 30-ms flashes at time 0 are shown. (Inset) Small averaged responses (mean ± SD) of hOpn1lwTg;RhoREY/REY;Gcaps/ (red, n = 6), WT (black, n = 15), and REY (gray, n = 11) rods, overlaid and normalized at peak for kinetics comparisons. Absolute amplitudes are 0.95 pA, 1.93 pA, and 1.58 pA, respectively. (C) Intensity–response relations of WT (black, n = 8) and REY (gray, n = 16) rods. Fitting with a single saturating-exponential function gave half-saturating flash strengths (ρ) of 6.21 and 46,168 (equivalent 500-nm) photons⋅μm−2 for WT and REY rods, respectively. Data points are means ± SD.
Fig. 3.
Fig. 3.
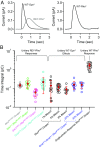
Estimate of single-GT*·PDE* effect from REY-Rho* responses. (A, Top) Responses of a WT rod (Left) and a REY rod (Right) to repetitive 10-ms, 500-nm flashes (vertical bars). For REY rods, multiple single-G*·PDE* effects were elicited at the chosen intensity, and therefore the probability of observing failures was low. (A, Bottom) Square of the ensemble mean (black on left; gray on right) overlaid on the ensemble variance (purple) of the responses. The cells are the same as at Top. Ratio between ensemble variance and ensemble mean allows estimation of the unitary response amplitude (Methods and SI Appendix, Supplementary Methods). (B, Bottom) Peak amplitudes of unitary responses of rods with WT (Left) or REY (Right) rhodopsin plotted against the mean response peak. The Grk1S561L (red on left; pink on right) and Grk1+/ (light green on left; dark green on right) mutations were used to shorten and lengthen Rho* lifetime, respectively (see text). Each open symbol represents one cell, with identical symbols representing the same cell being stimulated at multiple intensities. Solid circles are means ± SD. Brackets denote pairwise Student’s t tests on quantal response amplitudes with 0.0001 ≤ P < 0.05 and P < 0.0001 marked by single and double asterisks, respectively. No statistically significant differences between genotypes on right (P = 0.35 between Grk1S561L;RhoREY/REY;Gcaps/ and REY; P = 0.91 between Grk1+/;RhoREY/REY;Gcaps/ and REY). (B, Top) Averaged single-photon–response profiles of rods of the corresponding genotypes (see SI Appendix, Table S1 for kinetics measurements). (C) Similar to B but with genetic manipulation on GTα. The genotype Gnat1Tg;Gnat1/ reduces GTα expression to ∼6% of WT (Fig. 4). The difference between genotypes on right is not statistically significant (P = 0.20).
Fig. 4.
Fig. 4.
Generation and characterization of Gnat1Tg;Gnat1/ mice. (A) Construct design for the generation of Gnat1Tg mice. (B) Western blot quantification of GTα protein in Gnat1Tg;Gnat1/;RhoWT/WT;Gcaps/ retinae. Dilution of WT protein extracts produced a calibration curve for comparison in band intensities with Gnat1Tg;Gnat1/;RhoWT/WT;Gcaps/ (SI Appendix, Supplementary Methods). GTα protein is expressed at ∼6% of WT in Gnat1Tg;Gnat1/;RhoWT/WT;Gcaps/ retinae. Similar results were produced in several other experiments. (C) Intensity–response relations of WT (black, n = 8; reproduced from Fig. 2C) and Gnat1Tg;Gnat1/;RhoWT/WT;Gcaps/ (blue, n = 12) rods. Fitting with a single saturating-exponential function gave half-saturating flash strengths (ρ) of 6.21 and 24.32 (equivalent 500-nm) photons⋅μm−2 for the two genotypes, respectively. Data points are means ± SD. (D) Absorption spectra of Gnat1Tg;Gnat1/;RhoWT/WT;Gcaps/ (Left) and Gnat1Tg;Gnat1/;RhoREY/REY;Gcaps/ (Right) rods measured by in situ microspectrophotometry (SI Appendix, Supplementary Methods) show a normal absorption maximum of rhodopsin (cf. Fig. 1D). The reason for the lower expression levels of rhodopsin in the latter line is unclear, but this does not affect the fluctuation analysis (mean ± SD; n = 8). (E) Western blots showing the expression levels of various phototransduction components in retinal extracts from the indicated genotypes. The data for WT and REY are reproduced here from Fig. 1E for comparison.
Fig. 5.
Fig. 5.
Postbleach noise from Opn* in RhoWT/WT;Gcaps/ rods. (A) Noise recording before and after bleaching ∼1% of rhodopsin in a WT rod. (B, Left) Recordings from two different rods stored in darkness for >1 hr, showing steady current fluctuations (continuous noise) and occasional discrete events (marked with stars). (Right) Recordings from different rods after a 5% bleach and kept in darkness for 70 min, 140 min, or with similar bleach treatment, but subsequently incubated in 11-cis-retinal (SI Appendix, Supplementary Methods). (C) Steady–dark-current mean (Top) and continuous noise variance (Bottom) after a 5% bleach (blue), and after a 5% bleach followed by 11-cis-retinal incubation (green) for comparison with dark control rods (black). Each symbol represents a single cell. Solid lines show the cohort mean for each condition. From pairwise Student’s t tests, we found a significant difference in noise variance between dark control and post-5% bleach rods (P < 0.0001) and between post-5% bleach rods and regenerated rods (P < 0.0001), but not between dark control rods and regenerated rods (P = 0.26). Correspondingly, there was a significant difference in dark-current mean between dark control and post-5% bleach rods (0.0001 ≤ P < 0.05) and between post-5% bleach rods and regenerated rods (0.0001 ≤ P < 0.05), but not between dark control rods and regenerated rods (P = 0.82). (D, Left) Cohort-averaged continuous-noise power spectra from dark control rods (black) and from post-5% bleach rods (blue). Each frequency point indicates cohort mean ± SEM (n = 5 rods). (Middle and Right) Difference spectrum and waveform of the unitary Opn* effect (transient peak normalized to unity) extracted from the difference spectrum by fitting with the spectrum of a convolution of two single-exponential declines (blue curve, τ1 = 81 ± 35 msec, τ2 = 231 ± 25 msec, n = 5 rods).
Fig. 6.
Fig. 6.
Unitary GT*·PDE* events underlying constitutive Opn*-triggered activity in RhoWT/WT;Gcaps/ rods. (A) Waveform of unitary Opn* effects after a 1%, 5%, or 8% bleach (transient peak normalized to unity) extracted from difference spectra as in Fig. 5D (time constants in SI Appendix, Table S2). (B, Left) Unitary amplitudes of Opn-triggered events underlying postbleach noise after different bleaches of WT rods, derived from noise analysis (SI Appendix, Supplementary Methods). There was not a significant difference in amplitude across all bleaching conditions (P = 0.27, one-way ANOVA). Dashed line is the population mean amplitude from all bleach levels (each symbol represents a single cell). (B, Right) Cellular rate of events after different bleaches with percentage of total pigment content indicated below. Dashed line is a linear regression line passing through the origin (R2 = 0.8) with slope giving a molecular rate constant of 8.6 × 10⁻⁶ events⋅s−1⋅Opn−1. (C) Waveform of unitary Opn* effects after a 20% or 30% bleach (transient peak normalized to unity) extracted from difference spectra as in Fig. 5D, but with the Gnat1Tg;Gnat1/;RhoWT/WT;Gcaps/ line (time constants in SI Appendix, Table S2). (D, Top) Recordings from dark control (Left), 5%-bleached (Middle), and 8%-bleached (Right) rods from RhoWT/WT;Gcaps/ mice. (D, Bottom) Similar recordings from dark control (Left), 20%-bleached (Middle), and 30%-bleached Gnat1Tg;Gnat1/;RhoWT/WT;Gcaps/ rods with reduced GTα expression. Zero-current axes are aligned to illustrate the approximate magnitude of the change in dark current after bleaching. (E) Same analysis as B but with Gnat1Tg;Gnat1/;RhoWT/WT;Gcaps/ rods after a 20% or 30% bleach. (Left) Unitary amplitudes of Opn-triggered events were not significantly different from WT rods (P = 0.34, one-way ANOVA), and (Right) the event rate increased approximately in proportion to the amount of Opn formed (R2 = 0.8, molecular rate constant = 1.5 × 10⁻⁶ s−1⋅Opn−1). (F) Averaged single-photon responses from WT-Rho* in dark-adapted WT rods as well as after a 1%, 5%, and 8% bleach.
Fig. 7.
Fig. 7.
Comparison of individual GT*·PDE* effects with the unitary WT-Rho* response. (A, Left) Ensemble averages of single-GT*·PDE* effect profiles produced by WT-Opn* (n = 15) after a 5% bleach and by REY-Rho* in REY rods (n = 10). (A, Right) Ensemble average of the unitary WT-Rho* response in dark-adapted WT rods (n = 23). All measurements were in the Gcaps/ background for facilitating analysis of small responses. (B) Time-integrated profiles of single-GT*·PDE* effects and the single-WT-Rho* response. Each open symbol represents a single cell. Closed symbols are means ± SD. The time-integrated single-GT*·PDE* effects from all conditions were all within a range approximately an order of magnitude lower than that of the single-photon response from WT-Rho*. There was not a significant difference in values when comparing time-integrated profiles of single-GT*·PDE* effects from REY-Rho* with those from WT-Opn (P = 0.21, Student’s t test).

Comment in

References

    1. Baylor DA, Lamb TD, Yau K-W. Responses of retinal rods to single photons. J Physiol. 1979;288:613–634. - PMC - PubMed
    1. Vuong TM, Chabre M, Stryer L. Millisecond activation of transducin in the cyclic nucleotide cascade of vision. Nature. 1984;311:659–661. - PubMed
    1. Leskov IB, et al. The gain of rod phototransduction: Reconciliation of biochemical and electrophysiological measurements. Neuron. 2000;27:525–537. - PubMed
    1. Alberts B, et al. Molecular Biology of the Cell. 6th Ed. Garland Science; New York: 2015. Second messengers and enzymatic cascades amplify signals; p. 869.
    1. Kandel ER, Schwartz JH, Jessel TM, Siegelbaum SA, Hudspeth AJ. Principles of Neural Science. 5th Ed. McGraw-Hill Education; New York: 2012. Low-level visual processing: The retina; p. 583.

Publication types

LinkOut - more resources