. 2019 Feb 22;9(1):2617.
doi: 10.1038/s41598-019-38885-0.

Heterosubtypic cross-protection correlates with cross-reactive interferon-gamma-secreting lymphocytes in the ferret model of influenza

Affiliations

Heterosubtypic cross-protection correlates with cross-reactive interferon-gamma-secreting lymphocytes in the ferret model of influenza

Karen E Gooch et al. Sci Rep. .

Abstract

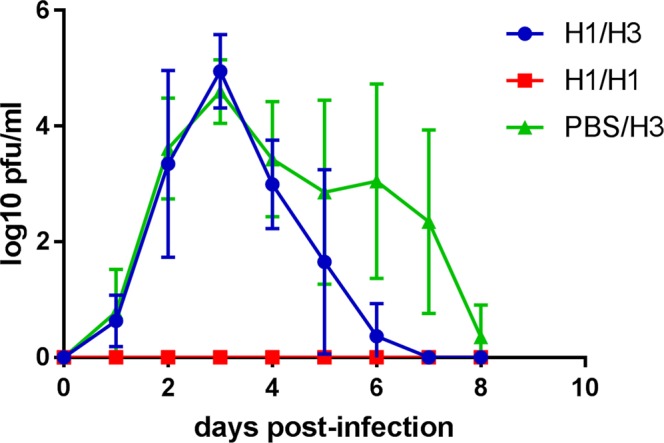
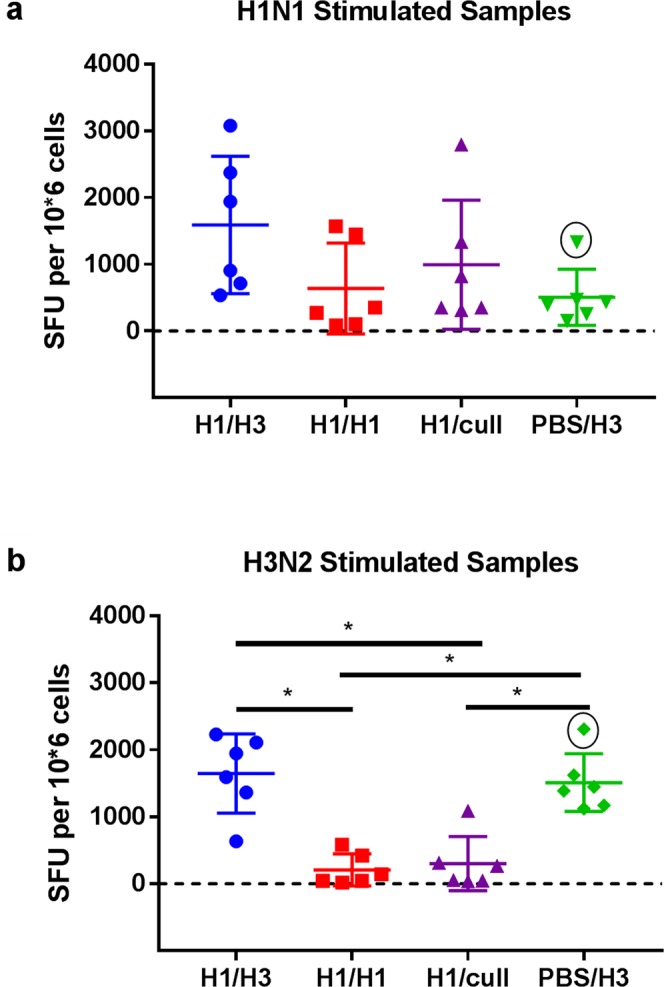
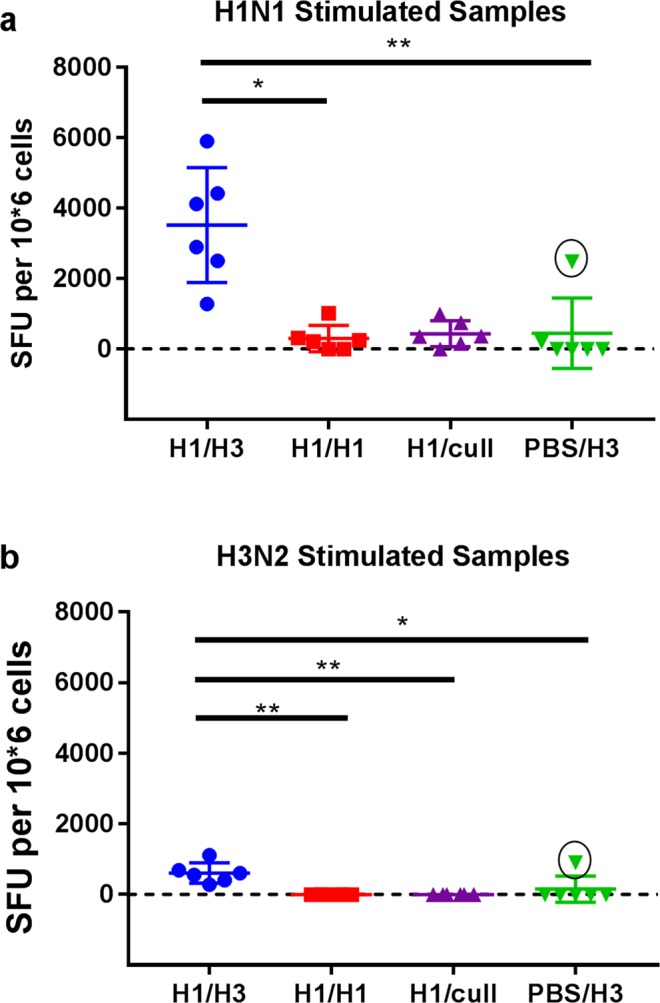
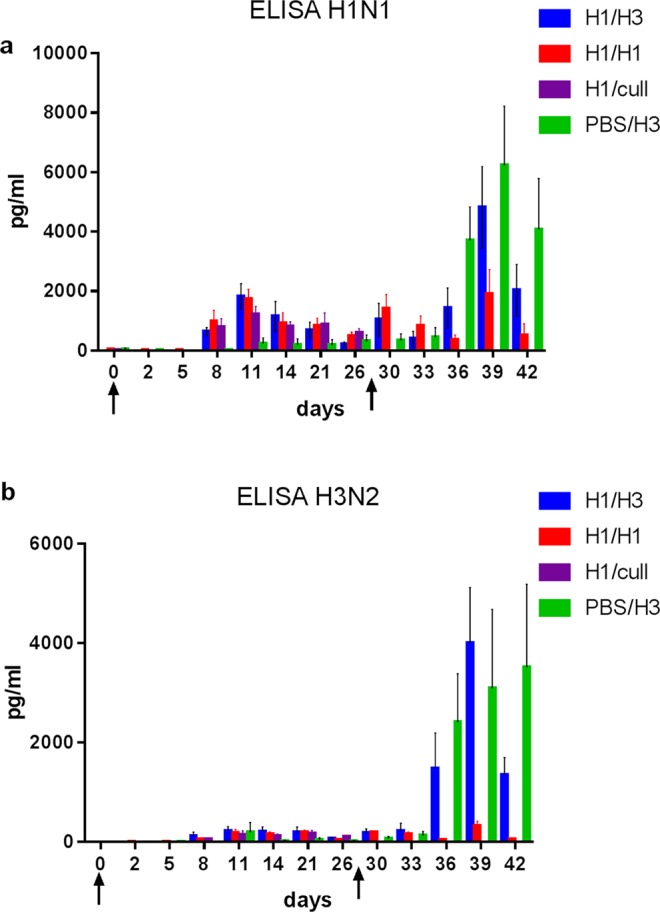
An effective universal vaccine for influenza will likely need to induce virus-specific T-cells, which are the major mediator of heterosubtypic cross-protection between different subtypes of influenza A virus. In this study we characterise the cell-mediated immune response in ferrets during heterosubtypic protection induced by low-dose H1N1 virus infection against an H3N2 virus challenge, given 4 weeks later. Although the ferrets were not protected against the infection by H3N2 virus, the duration of virus shedding was shortened, and clinical disease was markedly reduced. No cross-reactive neutralizing antibodies were detected, but cross-reactive interferon-gamma-secreting T cells were detected in the circulation prior to H3N2 challenge. These T-cells peaked at 11 days post-H1N1 infection, and were strongly induced in blood and in lung following H3N2 infection. The rapid induction of interferon-gamma-secreting cells in ferrets previously infected with H1N1 virus, but not in naïve ferrets, suggests induction of memory T-cells. These results are in accord with the observations that pre-existing cross-reactive T-cells correlate with protection in humans and have implications for outbreak modelling and universal vaccine design.


Conflict of interest statement

The authors declare no competing interests.

Figures

Figure 1
Figure 1
Study design. Each group comprised 6 ferrets. Groups H1/H3, H1/H1 and H1/cull received identical doses of 100 pfu H1N1 virus on day 0. Groups H1/H3 and PBS/H3 received identical doses of 100 pfu H3N2 virus on day 28, whereas group H1/H1 received a second 100 pfu dose of H1N1 virus (homologous challenge). Nasal washes, heparinised blood samples and sera were collected from all animals at time-points specified in Methods. Red triangles indicate collection of PBMC and lung lymphocyte samples. i.n., intra-nasal inoculation.
Figure 2
Figure 2
Signs of clinical disease following second virus challenge. Groups H1/H3 and PBS/H3 were challenged with H3N2 virus, group H1/H1 with H1N1 virus. (a) frequency of sneezing following challenge, sum for each group; (b) AUC for temperature between 50 and 82 hours post-challenge; (c) AUC for weight between days 0 and 14 post-challenge. Weights were normalised to weight on day of challenge. In panels b and c, points represent individual ferrets and bars represent group means and standard deviations. Groups were compared by 1-way ANOVA with Holm-Sidak’s multiple comparisons test. *p < 0.05; ***p < 0.001.
Figure 3
Figure 3
Virus titres in nasal wash following second virus challenge. Points show log mean with standard deviation for each group. Time 0 samples were collected 2 days prior to challenge.
Figure 4
Figure 4
Nasal wash live cell counts. Lines show mean and standard deviation for each group. Ferrets were infected on days 0 and 28 (arrows).
Figure 5
Figure 5
Antibody response to initial infection with H1N1 virus (or PBS control). (a) geometric mean HAI titres, (b) geometric mean neutralization titres. Limit of detection in a is 4, values < 4 were scored as 2. Limit of detection in b is 10, values < 10 were scored as 5. Error bars show standard deviation. Solid bars show response to H1N1 virus, hatched bars show response to H3N2 virus. Sera were collected 24 days post-infection.
Figure 6
Figure 6
ELISpot titres in PBMC. (a) stimulation with H1N1 virus, (b) stimulation with H3N2 virus. Points show individual ferrets, with mean and standard deviation overlaid. Groups were compared by Kruskall-Wallis test, using Dunn’s multiple comparisons test. *p < 0.05. The values marked with a circle in group PBS/H3 are from the same ferret.
Figure 7
Figure 7
ELISpot titres in lung MNC. (a) stimulation with H1N1 virus, (b) stimulation with H3N2 virus. Points show individual ferrets, with mean and standard deviation overlaid. Groups were compared by Kruskall-Wallis test, using Dunn’s multiple comparisons test. *p < 0.05, **p < 0.01. The values marked with a circle in group PBS/H3 are from the same ferret as highlighted in Fig. 6.
Figure 8
Figure 8
Whole blood IFN-γ ELISA. Bars show group mean values in pg/ml following stimulation with (a) H1N1 virus and (b) H3N2 virus. Arrows indicate the timing of the first and second infections, at days 0 and 28. Error bars show standard error of the mean. Upper limit of detection was 12000 pg/ml.

References

    1. World Health Organization Influenza (seasonal) fact sheet. http://www.who.int/mediacentre/factsheets/fs211/en/ Accessed 14-feb-18 (2018).
    1. Carrat F, Flahault A. Influenza vaccine: the challenge of antigenic drift. Vaccine. 2007;25:6852–6862. doi: 10.1016/j.vaccine.2007.07.027. - DOI - PubMed
    1. Hillaire ML, Rimmelzwaan GF, Kreijtz JH. Clearance of influenza virus infections by T cells: risk of collateral damage? Current opinion in virology. 2013;3:430–437. doi: 10.1016/j.coviro.2013.05.002. - DOI - PubMed
    1. Cox RJ, Brokstad KA, Ogra P. Influenza virus: immunity and vaccination strategies. Comparison of the immune response to inactivated and live, attenuated influenza vaccines. Scandinavian journal of immunology. 2004;59:1–15. - PubMed
    1. Grant EJ, Quinones-Parra SM, Clemens EB, Kedzierska K. Human influenza viruses and CD8(+) T cell responses. Current opinion in virology. 2016;16:132–142. doi: 10.1016/j.coviro.2016.01.016. - DOI - PubMed

Publication types

MeSH terms

Substances