. 2019 Feb 22;9(1):2594.
doi: 10.1038/s41598-019-39141-1.

Transcriptomic profiles of retinal ganglion cells are defined by the magnitude of intraocular pressure elevation in adult mice

Affiliations

Transcriptomic profiles of retinal ganglion cells are defined by the magnitude of intraocular pressure elevation in adult mice

Yong H Park et al. Sci Rep. .

Abstract

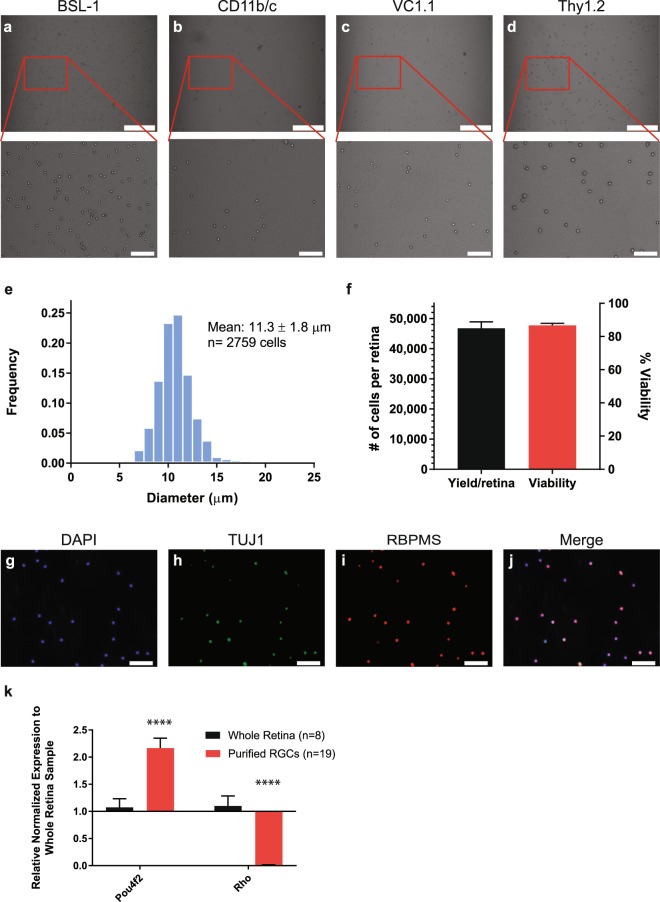
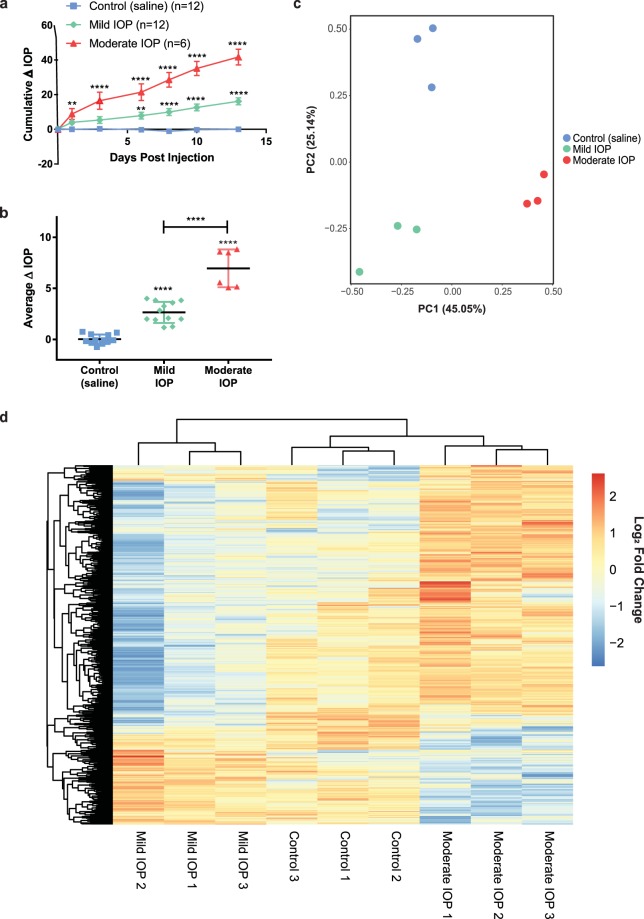
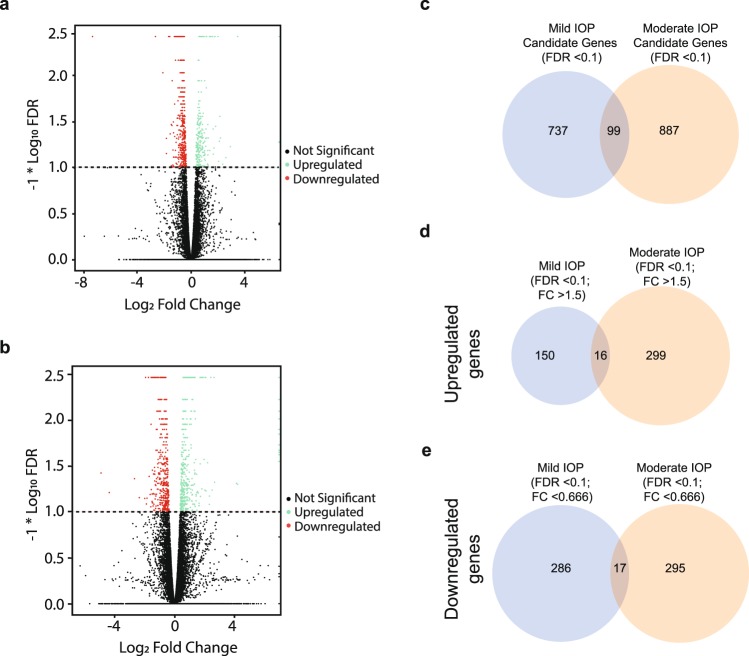
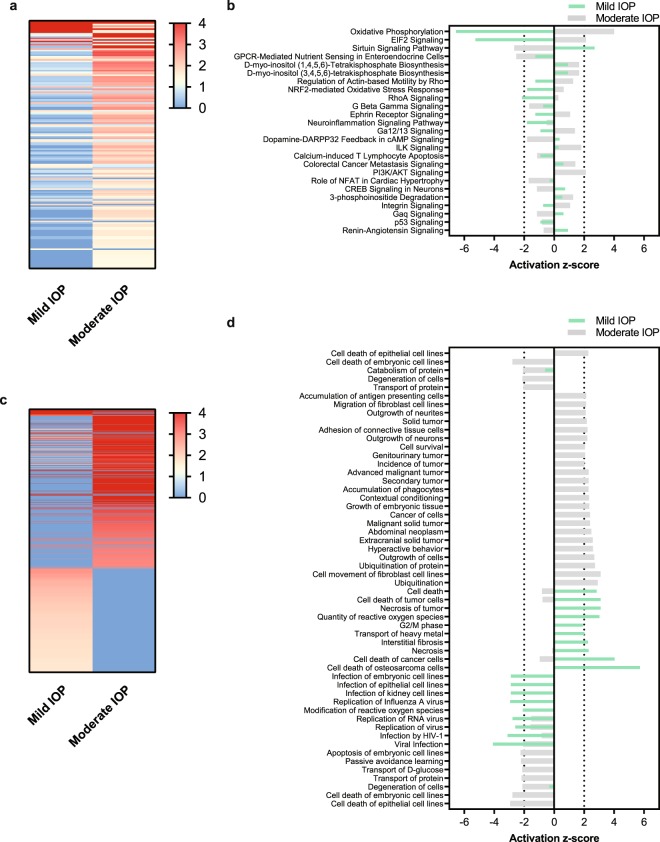
Elevated intraocular pressure (IOP) is the major risk factor for glaucoma, a sight threatening disease of retinal ganglion cells (RGCs) and their axons. Despite the central importance of IOP, details of the impact of IOP elevation on RGC gene expression remain elusive. We developed a 4-step immunopanning protocol to extract adult mouse RGCs with high fidelity and used it to isolate RGCs from wild type mice exposed to 2 weeks of IOP elevation generated by the microbead model. IOP was elevated to 2 distinct levels which were defined as Mild (IOP increase >1 mmHg and <4 mmHg) and Moderate (IOP increase ≥4 mmHg). RNA sequencing was used to compare the transcriptional environment at each IOP level. Differentially expressed genes were markedly different between the 2 groups, and pathway analysis revealed frequently opposed responses between the IOP levels. These results suggest that the magnitude of IOP elevation has a critical impact on RGC transcriptional changes. Furthermore, it is possible that IOP-based set points exist within RGCs to impact the direction of transcriptional change. It is possible that this improved understanding of changes in RGC gene expression can ultimately lead to novel diagnostics and therapeutics for glaucoma.


Conflict of interest statement

The authors declare no competing interests.

Figures

Figure 1
Figure 1
Characterization of Purified RGCs Isolated from Adult Mice. (ad) Brightfield images (10x) were taken following each panning step during the isolation of adult RGCs from mice: (a) BSL-1 (fibroblasts, endothelial cells, macrophages and microglia), (b) CD11b/c (macrophages and microglia), (c) VC1.1 (amacrine cells), and (d) Thy1.2 (RGCs; scale bar = 250 µm). As expected, Thy1.2+ cells (inset, d) were larger than BSL-1+ (inset, a), CD11b/c+ (inset, b), and VC1.1+ (inset, c) cells (scale bar = 50 µm). (e) Bar graph showing the distribution of the diameter (µm) of the Thy1.2+ cells (n = 2,759 cells). The average cell diameter was 11.3 ± 1.8 µm. (f) 4-step immunopanning of RGCs average yield of 46,718 ± 2,176 cells per retina with an 86.7 ± 1.2% viability per isolation (n = 21). Immunostaining of the isolated cells against RGC Markers, TUJ1 (h) and RBPMS (i), as well as a nuclear stain, DAPI (g; scale bar = 50 µm). Merged image (j) identified 88.1 ± 4.2% of DAPI positive cells to be RBPMS positive. (k) Semi-quantitative q-PCR analysis identified a significant (p < 0.0001) increase in expression of Pou4f2 (RGC marker) and significant decrease (p < 0.0001) in the expression of Rhodopsin (Rho; Photoreceptor gene marker) in the purified RGCs samples compared to the whole retina.
Figure 2
Figure 2
Transcriptomic Profiling Analysis of RGCs Following Mild and Moderate IOP Elevation. (a) Cumulative change in IOP for eyes exposed to Mild IOP (green), Moderate IOP (red), and Control (blue) conditions over a 2 week period. (b) Mean change in IOP per group. IOP levels were significantly increased after Mild (2.7 ± 0.3 mmHg) and Moderate (7.0 ± 0.8 mmHg) IOP increase when compared to Controls (0.0 ± 0.1 mmHg). For (a,b), **P < 0.01 and ****P < 0.0001. (c) PCA plot of Control, Mild IOP, and Moderate IOP in triplicate. (d) Hierarchical dendrogram clustering/heatmap of Control, Mild IOP, Moderate IOP samples’ gene expression with FPKM > 16.
Figure 3
Figure 3
Differentially Expressed Genes Following Mild and Moderate IOP Elevation. (a,b) Volcano plots of significantly (FDR < 0.1) differently expressed genes (DEGs) for both Mild (a) and Moderate (b) IOP levels (above dotted line). Upregulated DEGs (Log2 fold change of ≥0.5849 or ≥1.5-fold change) and downregulated DEGs (Log2 fold change of ≤−0.5849 or ≤0.666-fold change), are indicated in green and red, respectively. Genes with Log2 Fold change of <|0.5849| are not significant (black). (c) Venn Diagram depicting the overlap of significant (FDR < 0.1) candidate DEGs in the Mild and Moderate IOP groups (does not include fold-change criteria). (d,e) Venn Diagrams of overlapping significantly (FDR < 0.1 and Log2 fold change of ≥|0.5849|) identified for up- (d) and down- (e) regulated DEGs.
Figure 4
Figure 4
Pathway Analysis Following Mild and Moderate IOP. Ingenuity Pathway Analysis of Mild and Moderate IOP compared to Control. (a,c) Heatmap of the significant changes to the canonical pathway (a) and disease/bio functions (c) filtered by −log (P-value). (b,d) Activation z-score directionality graph of the top significant (−log (P-value) > 1.3) canonical pathways (b) and disease/bio functions (d) for both Mild and Moderate IOP elevation. Canonical pathways and disease/bio functions with a Z-score ≥ |2| are significant, were a positive value is considered to be activated and a negative value is considered to be inactivated.

References

    1. Quigley HA. Neuronal death in glaucoma. Prog Retin Eye Res. 1999;18:39–57. doi: 10.1016/S1350-9462(98)00014-7. - DOI - PubMed
    1. Quigley HA, Broman AT. The number of people with glaucoma worldwide in 2010 and 2020. Br J Ophthalmol. 2006;90:262–267. doi: 10.1136/bjo.2005.081224. - DOI - PMC - PubMed
    1. Friedman DS, et al. Prevalence of open-angle glaucoma among adults in the United States. Arch Ophthalmol. 2004;122:532–538. doi: 10.1001/archopht.122.7.1019. - DOI - PMC - PubMed
    1. Weinreb RN, Aung T, Medeiros FA. The pathophysiology and treatment of glaucoma: a review. JAMA. 2014;311:1901–1911. doi: 10.1001/jama.2014.3192. - DOI - PMC - PubMed
    1. Weinreb RN, et al. Primary open-angle glaucoma. Nat Rev Dis Primers. 2016;2:16067. doi: 10.1038/nrdp.2016.67. - DOI - PubMed

Publication types