

Goat and buffalo milk fat globule membranes exhibit better effects at inducing apoptosis and reduction the viability of HT-29 cells
- PMID: 30796323
- PMCID: PMC6385370
- DOI: 10.1038/s41598-019-39546-y
Goat and buffalo milk fat globule membranes exhibit better effects at inducing apoptosis and reduction the viability of HT-29 cells
Abstract
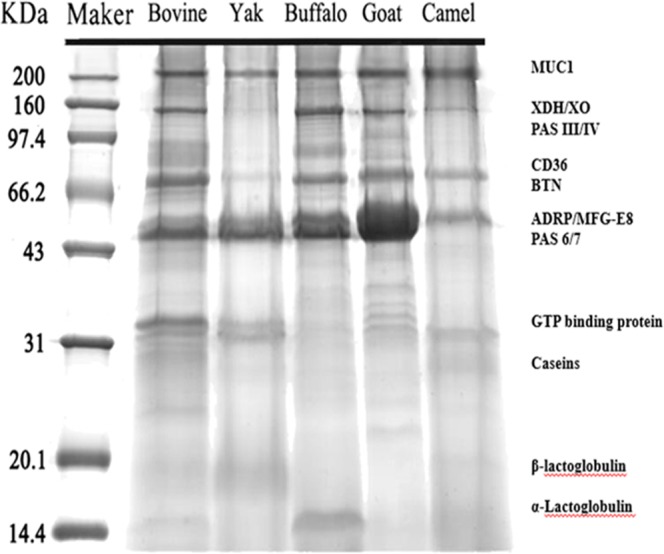
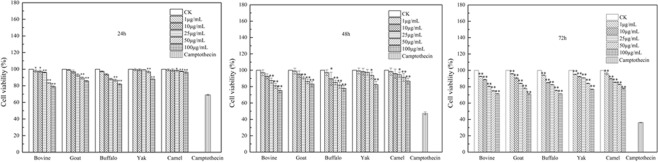
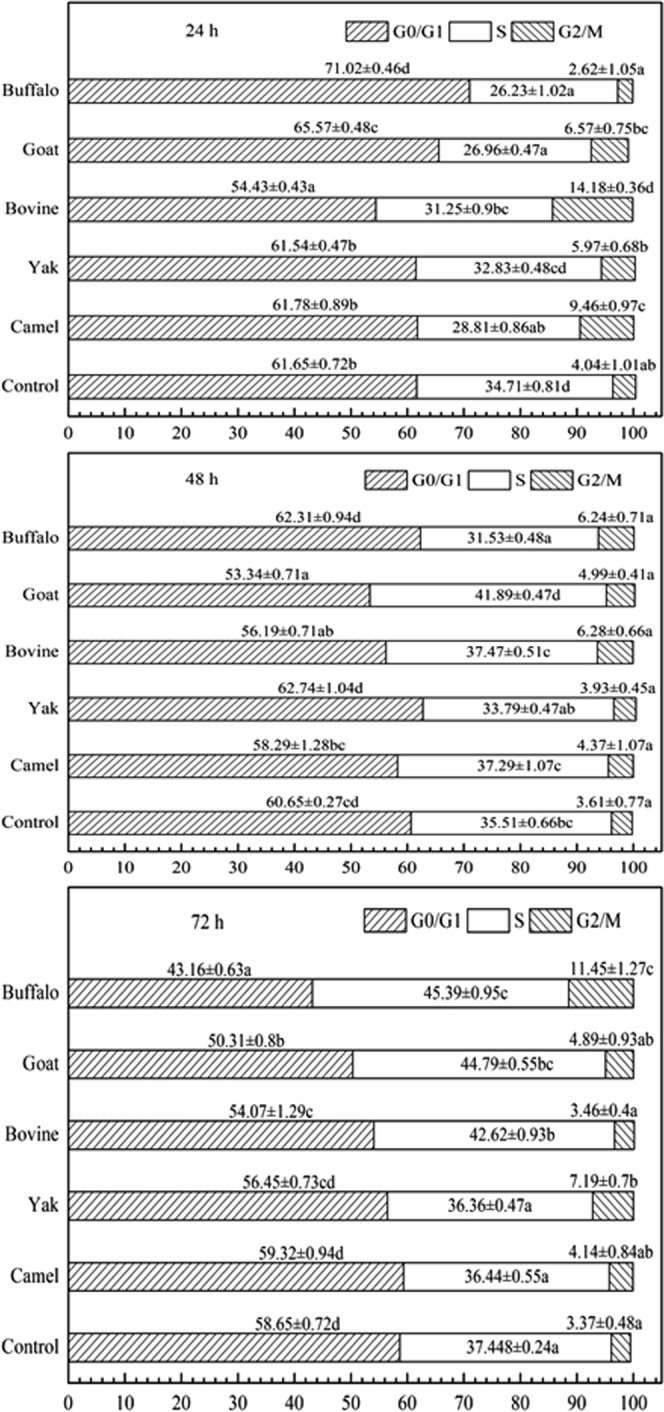
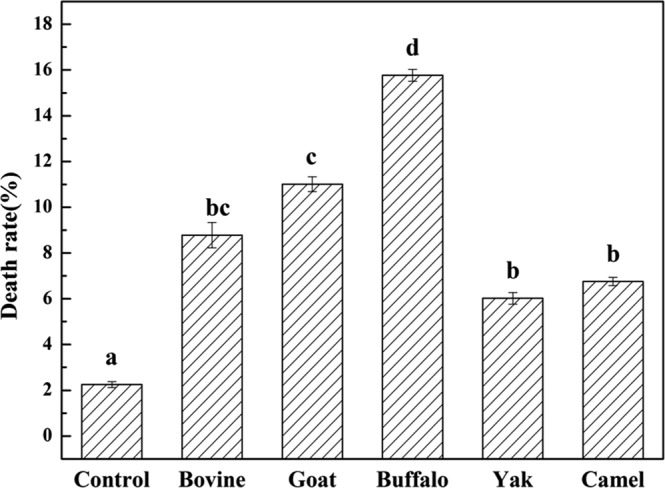
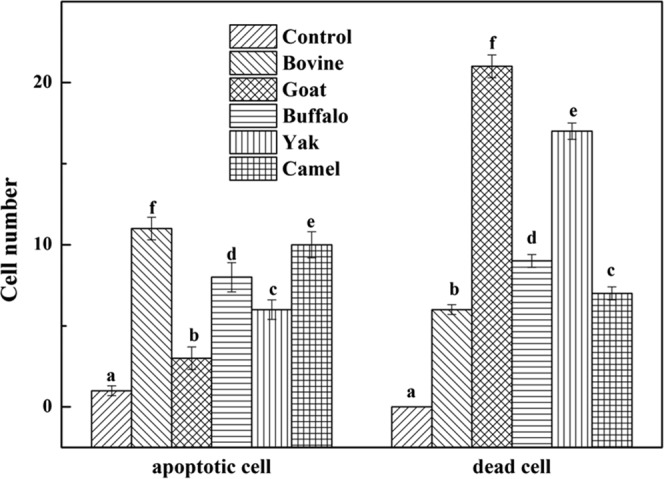
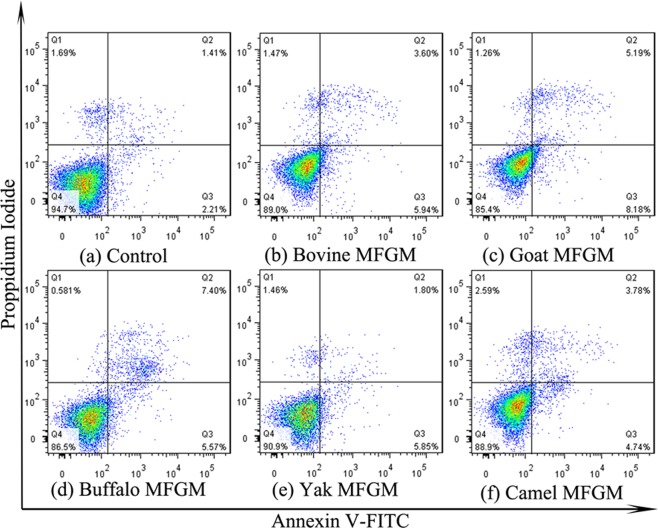
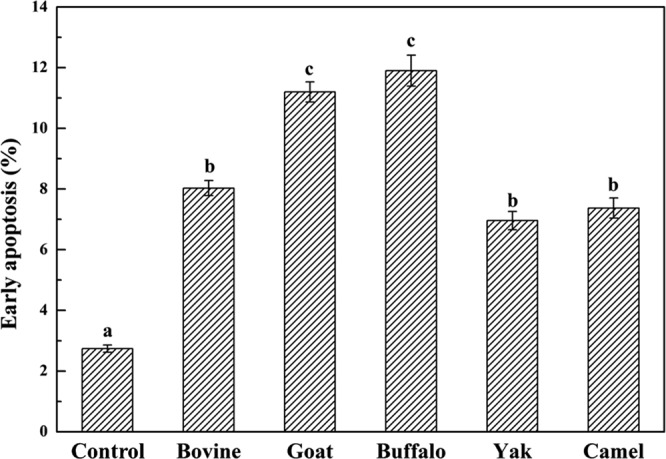
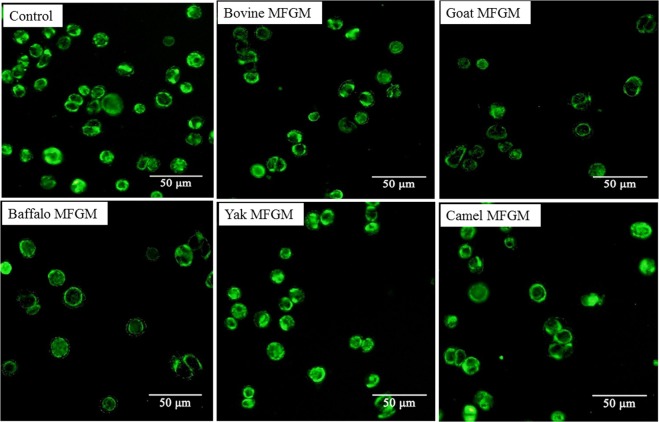
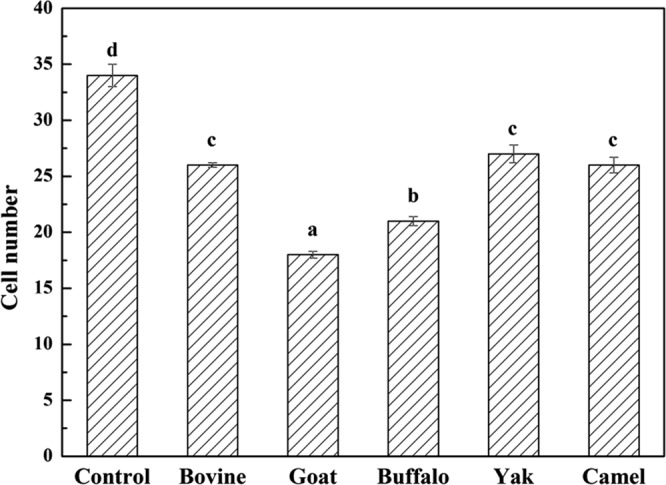
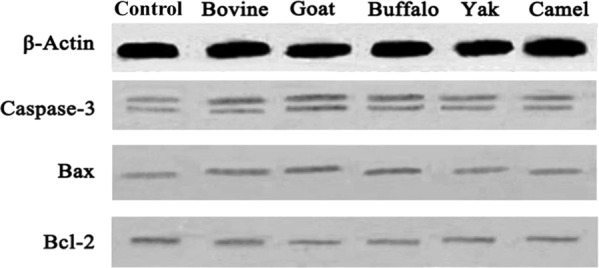
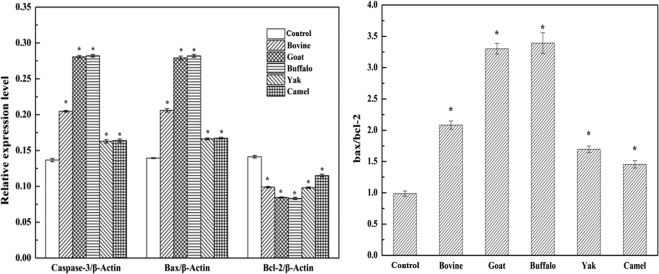
Bovine milk fat globule membrane (MFGM) has shown many health benefits, however, there has not been much study on non-cattle MFGMs. The purpose of this study was to compare the anti-proliferation effects and investigate the mechanisms of MFGMs from bovine, goat, buffalo, yak and camel milk in HT-29 cells. Results showed that protein content in MFGM of yak milk is the highest among five MFGM. All MFGMs reduced cellular viability which was in agreement with cell morphology and apoptosis. However, the number of cells in S-phase from 24 h to 72 h was increased significantly by treatment with goat, buffalo and bovine MFGMs (100 μg/mL), but not yak and camel. All MFGMs treatment significantly reduced the mitochondrial membrane potential (with an order of goat > buffalo > bovine > camel > yak) and Bcl-2 expression, but increased the expression of both Bax and Caspase-3. Taken together, the results indicate that all MFGMs, especially goat and buffalo MFGMs, showed better effects at inducing apoptosis and reduction the viability of HT-29 cells. The mechanism might be arresting the cell cycle at S phase, depolarization of mitochondrial membrane potential, down-regulation of Bcl-2 expression and increase of Bax and Caspase-3 expression.
Conflict of interest statement
The authors declare no competing interests.
Figures
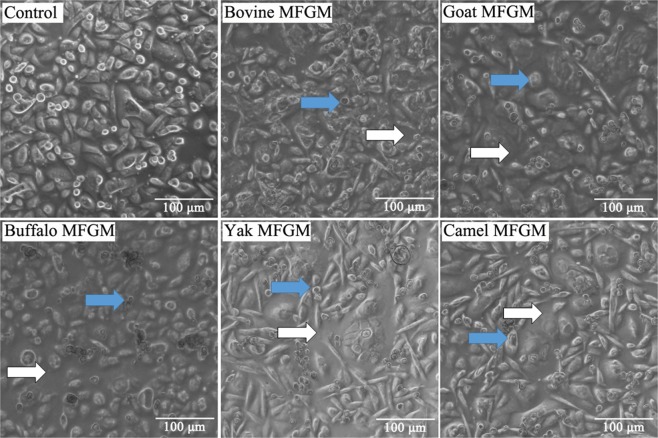
 ) and lost contact between adjacent cells (
 ).
).
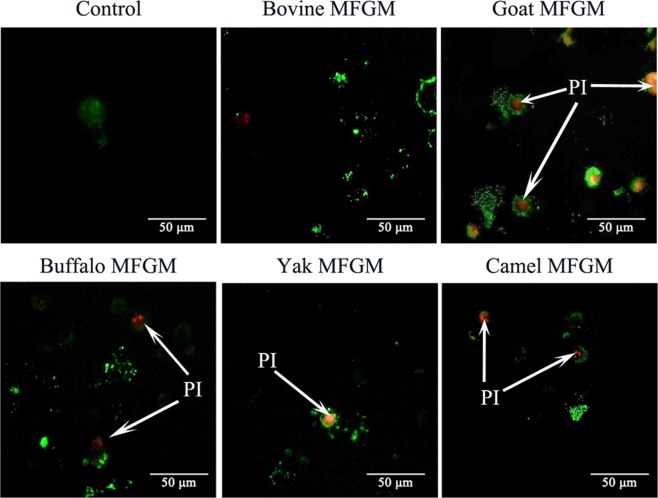
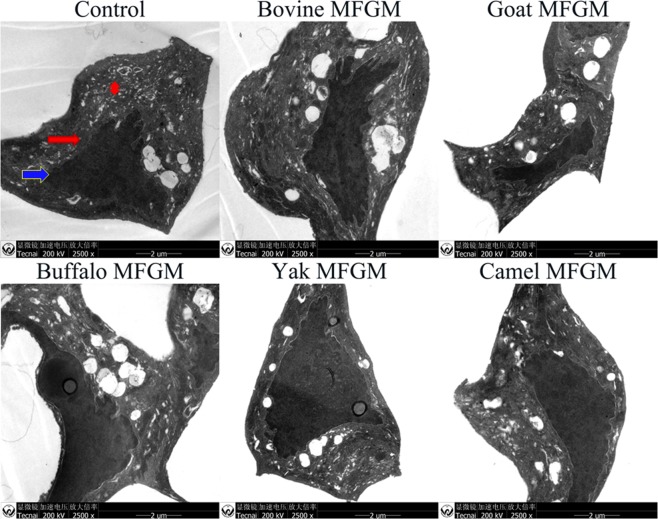
 ); nuclei (
 ); cytoplasm (
 ).
).
Similar articles
-
A comparison of milk fat globule membranes and whey proteomes: New insight into variation nutrient differences between Buffalo, Cow, Goat, and Yak.Food Chem. 2023 Dec 15;429:136845. doi: 10.1016/j.foodchem.2023.136845. Epub 2023 Jul 12. Food Chem. 2023. PMID: 37453337
-
Proteomic characterization and comparison of mammalian milk fat globule proteomes by iTRAQ analysis.J Proteomics. 2015 Feb 26;116:34-43. doi: 10.1016/j.jprot.2014.12.017. Epub 2015 Jan 8. J Proteomics. 2015. PMID: 25576853
-
Milk fat globule membrane isolate induces apoptosis in HT-29 human colon cancer cells.Food Funct. 2013 Feb;4(2):222-30. doi: 10.1039/c2fo30189j. Food Funct. 2013. PMID: 23070113
-
Whole Goat Milk as a Source of Fat and Milk Fat Globule Membrane in Infant Formula.Nutrients. 2020 Nov 13;12(11):3486. doi: 10.3390/nu12113486. Nutrients. 2020. PMID: 33202897 Free PMC article. Review.
-
Milk fat globule membrane components--a proteomic approach.Adv Exp Med Biol. 2008;606:129-41. doi: 10.1007/978-0-387-74087-4_4. Adv Exp Med Biol. 2008. PMID: 18183927 Review.
Cited by
-
Advancement on Milk Fat Globule Membrane: Separation, Identification, and Functional Properties.Front Nutr. 2022 Jan 28;8:807284. doi: 10.3389/fnut.2021.807284. eCollection 2021. Front Nutr. 2022. PMID: 35155526 Free PMC article. Review.
-
Comprehensive analysis of species-specific differences in fatty acid composition and proteome of milk fat globules in human and animals.Food Chem X. 2025 Apr 1;27:102431. doi: 10.1016/j.fochx.2025.102431. eCollection 2025 Apr. Food Chem X. 2025. PMID: 40248317 Free PMC article.
-
Comparative Proteomics of Milk Fat Globule Membrane (MFGM) Proteome across Species and Lactation Stages and the Potentials of MFGM Fractions in Infant Formula Preparation.Foods. 2020 Sep 7;9(9):1251. doi: 10.3390/foods9091251. Foods. 2020. PMID: 32906730 Free PMC article. Review.
-
Analysis of the Factors Affecting Static In Vitro Pepsinolysis of Food Proteins.Molecules. 2022 Feb 14;27(4):1260. doi: 10.3390/molecules27041260. Molecules. 2022. PMID: 35209049 Free PMC article.
-
Breast Milk Lipids and Fatty Acids in Regulating Neonatal Intestinal Development and Protecting against Intestinal Injury.Nutrients. 2020 Feb 19;12(2):534. doi: 10.3390/nu12020534. Nutrients. 2020. PMID: 32092925 Free PMC article. Review.
References
-
- Leader, V. K. G. The milk fat globule membrane. John Wiley & Sons, Ltd. 631–668 (2015)
-
- Fong BY, Norris CS, Macgibbon AKH. Protein and lipid composition of bovine milk-fat-globule membrane. Int. Dairy J. 2007;17:275–288. doi: 10.1016/j.idairyj.2006.05.004. - DOI
-
- Smoczyński M, Staniewski B, Kiełczewska K. Composition and structure of the bovine milk fat globule membrane—some nutritional and technological implications. Food Rev Int. 2012;28:188–202. doi: 10.1080/87559129.2011.595024. - DOI
-
- Kuchta AM, Kelly PM, Stanton C, Devery RA. Milk fat globule membrane – a source of polar lipids for colon health? A review. Int. J. Dairy Technol. 2012;65:315–333. doi: 10.1111/j.1471-0307.2011.00759.x. - DOI
Publication types
MeSH terms
Substances
LinkOut - more resources
Full Text Sources
Research Materials
