Review
. 2019 Feb 22;10(1):24.
doi: 10.1186/s13244-019-0700-3.

Neuroimaging of acute and chronic unilateral and bilateral thalamic lesions

Affiliations
Review

Neuroimaging of acute and chronic unilateral and bilateral thalamic lesions

C Tuttle et al. Insights Imaging. .

Abstract

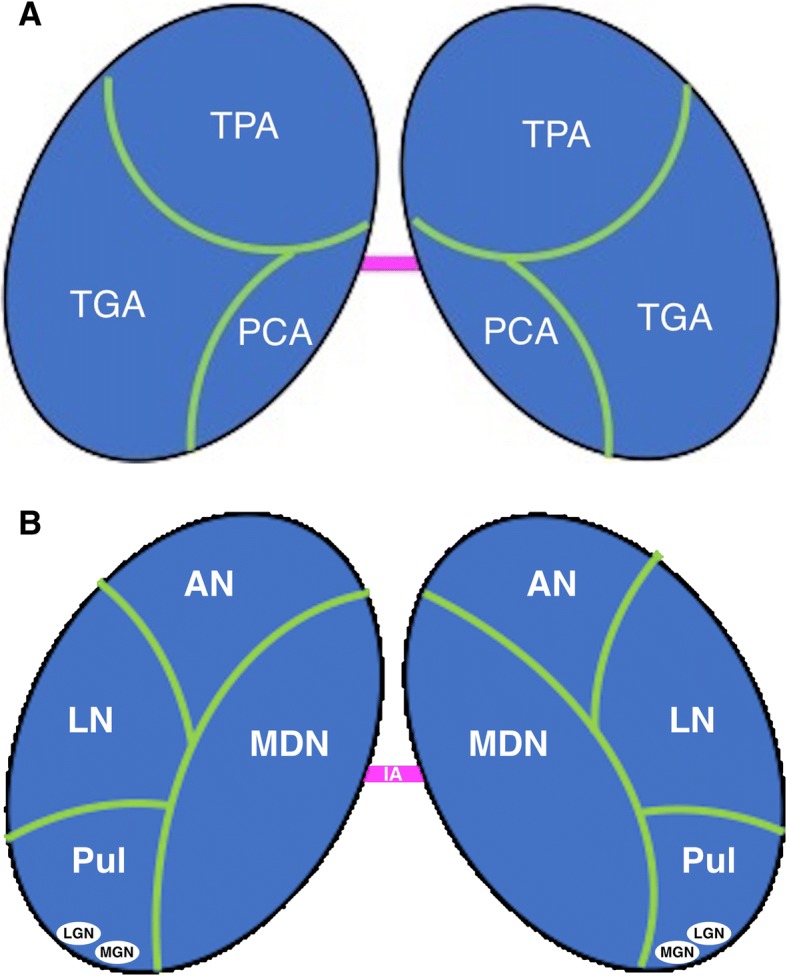
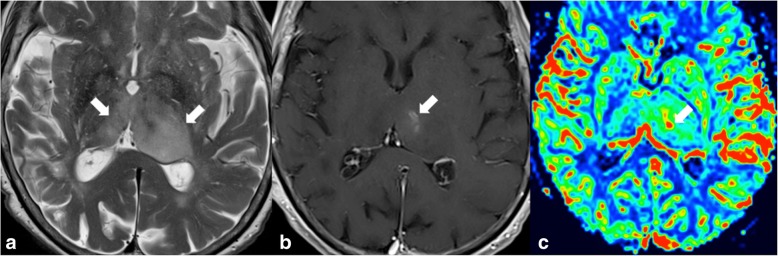
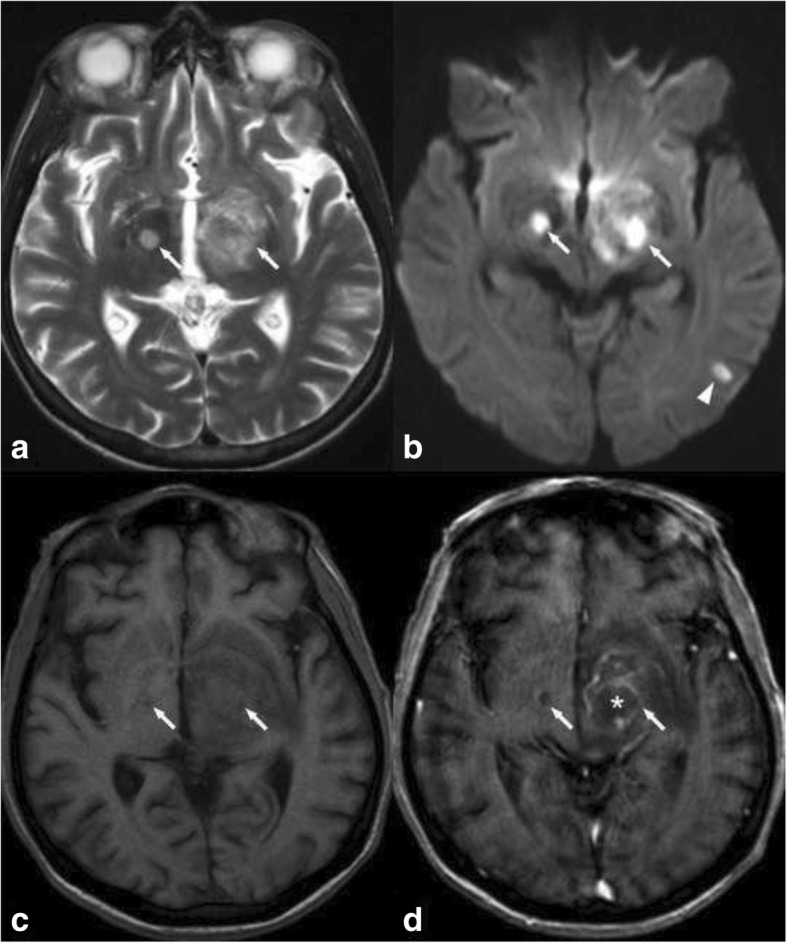
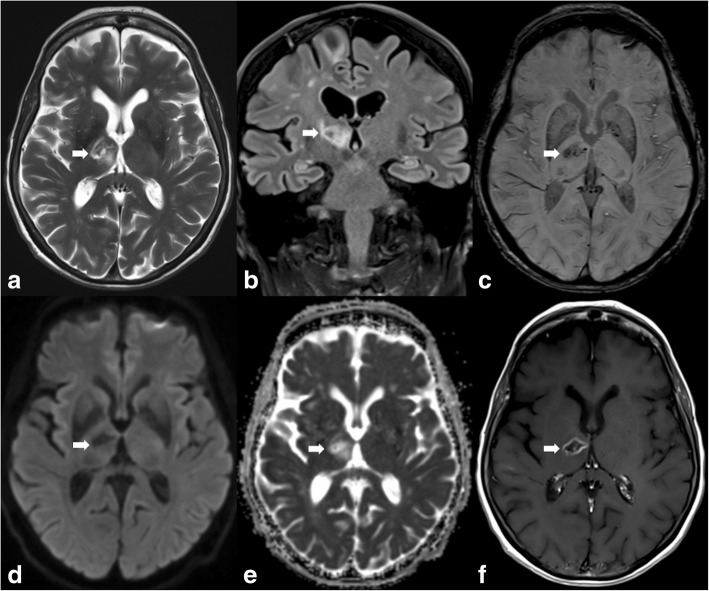
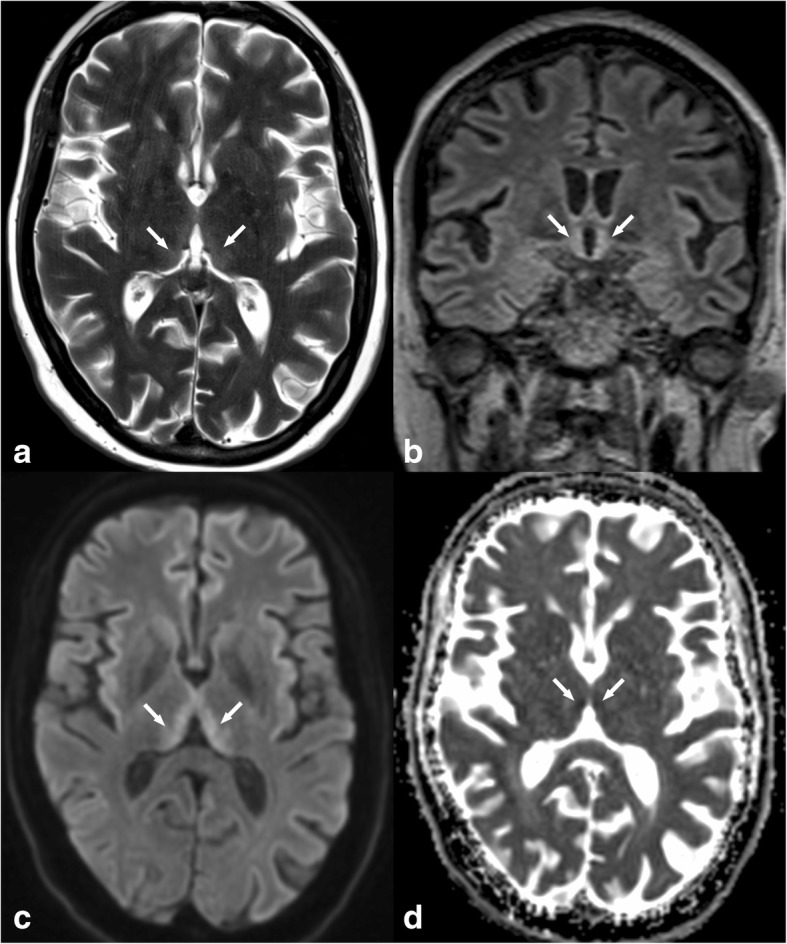
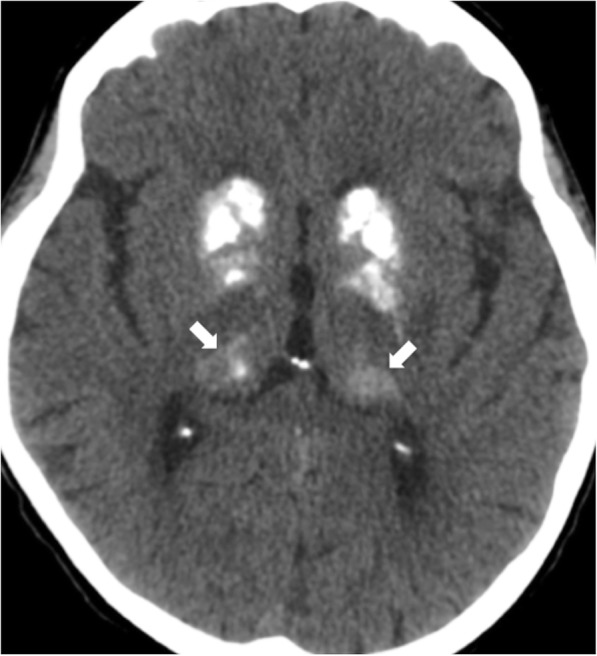
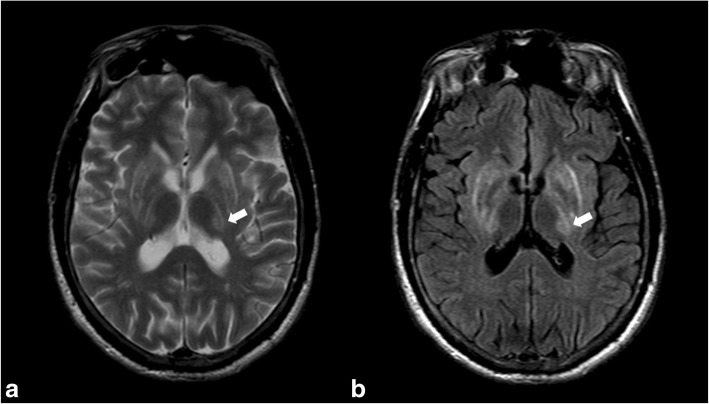
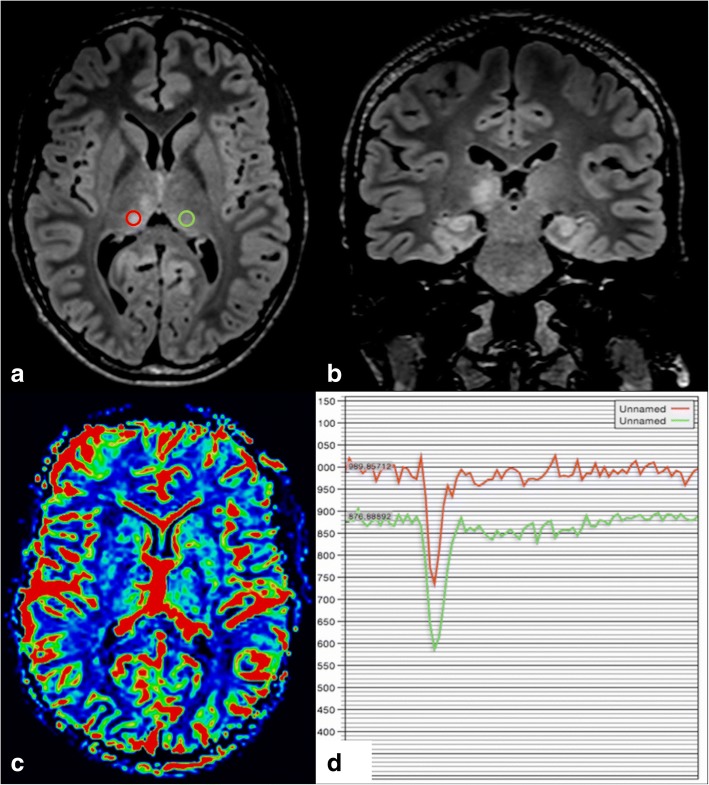
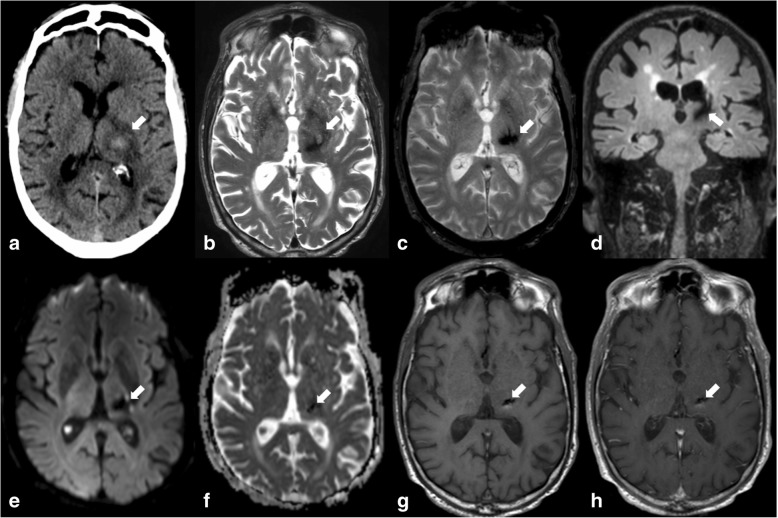
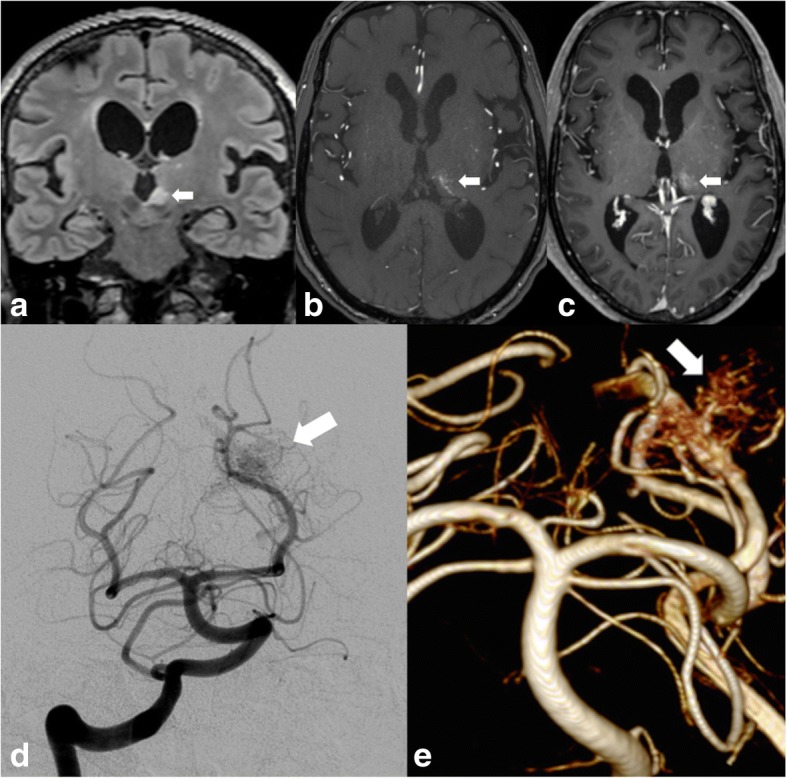
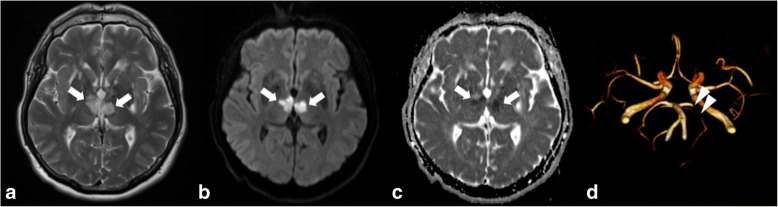
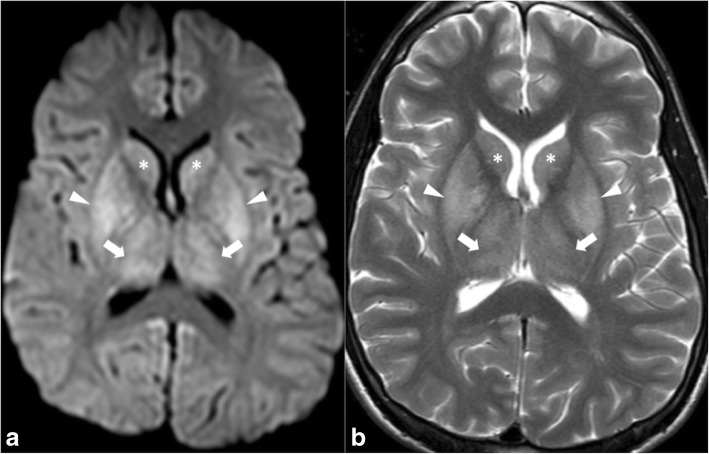
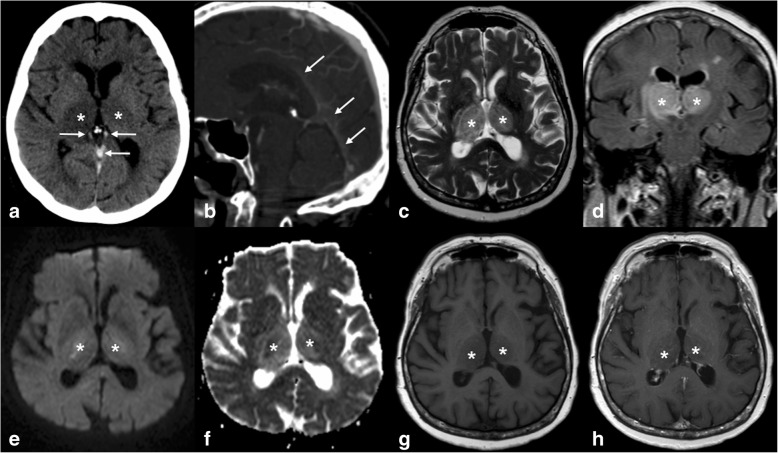
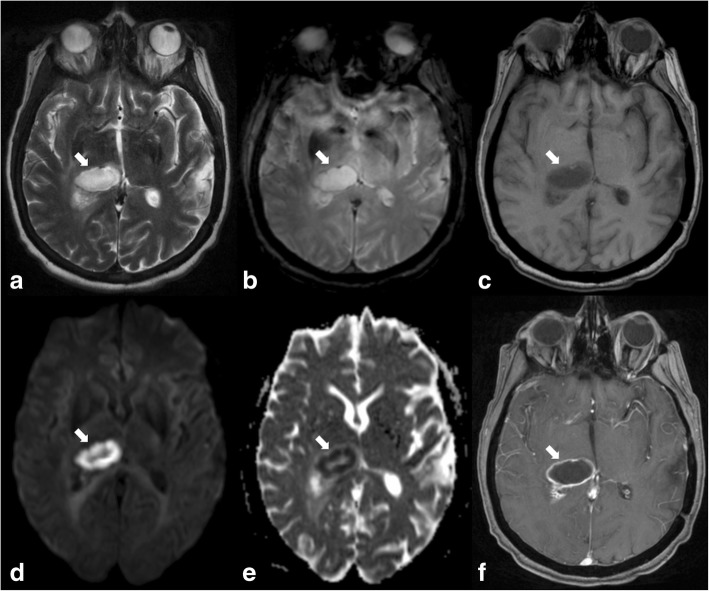
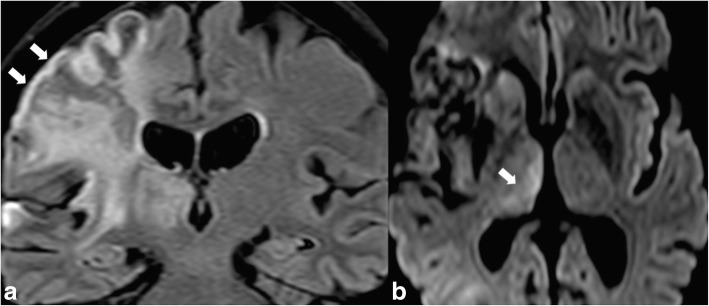
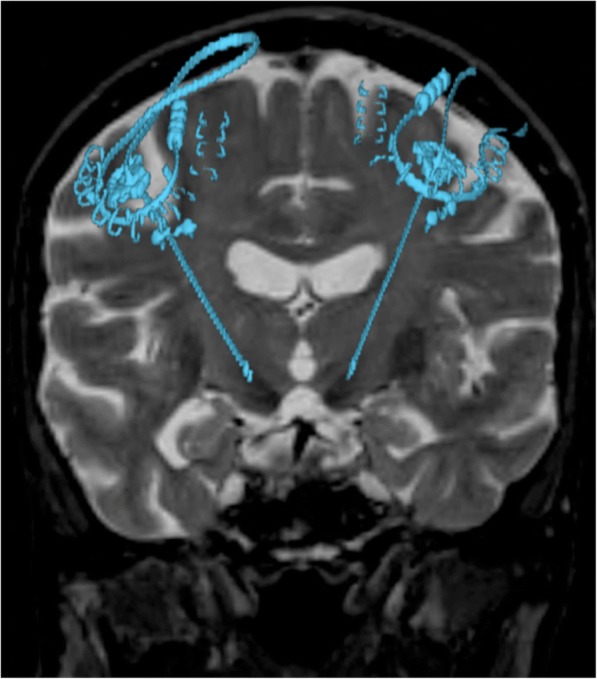
The thalami are bilateral ovoid grey matter cerebral structures bordering the third ventricle on both sides, which participate in functions such as relaying of sensory and motor signals, regulation of consciousness, and alertness. Pathologies affecting the thalami can be of neoplastic, infectious, vascular, toxic, metabolic, or congenital origin.The purpose of this review is to provide a comprehensive approach to the thalamus focusing on its anatomy, the main pathologies affecting this structure and their radiological semiology on CT and MRI. We will also illustrate the importance of multimodal MR imaging (morphologic sequences, diffusion-weighted imaging, perfusion, spectroscopy) for the diagnosis and treatment of these conditions.

Keywords: Computed tomography; Deep brain stimulation; Infection; Magnetic resonance imaging; Neoplasia; Thalami; Vascular and ischaemic diseases.


Conflict of interest statement

Competing interests

The authors declare that they have no competing interests.

Publisher’s Note

Springer Nature remains neutral with regard to jurisdictional claims in published maps and institutional affiliations.

Figures

Fig. 1
Fig. 1
Diagrams show the different anatomic regions of the thalamus (a) and its vascularisation (b). TPA, thalamoperforating arteries; TGA, thalamogeniculate arteries; PCA, posterior choroidal artery; AN, anterior nucleus; LN, lateral nuclei; MDN, mediodorsal nuclei; Pul, pulvinar; LNG, lateral geniculate nucleus; MGN, medial geniculate nucleus
Fig. 2
Fig. 2
T2WI hyperintense lesions in the thalami (arrows in a), with mass effect on the third and left lateral ventricles, showing faint enhancement on the left thalamus (arrow in b). Note that the hypervascularisation on the CBV map sequence (arrow in c), reflecting neoangiogenesis, perfectly matches the enhancing component of the lesion, which corresponded to a biopsy-proven high-grade glioma
Fig. 3
Fig. 3
T2WI and DWI hyperintense lesions in both thalami (arrows in a and b). The lesions are hypointense on T1, and there is a non-enhancing central region corresponding to an area of necrosis (* in d). This pattern of enhancement suggests lymphoma in immunocompromised patients
Fig. 4
Fig. 4
MRI illustrates a T2WI and FLAIR hyperintense lesion in the right thalamus and posterior limb of the internal capsule (arrows in a and b). There is a small haemorrhagic component seen on SWI (arrow in c). No diffusion restriction is observed (arrows in d and e), and there is ring enhancement (arrow in f)
Fig. 5
Fig. 5
Axial FSE T2 (a) and coronal FLAIR (b) illustrate hyperintensity surrounding the third ventricle (arrows). These abnormalities are associated with diffusion restriction (arrows in c and d)
Fig. 6
Fig. 6
High attenuation in the basal ganglia and thalami (arrows) on non-contrast CT due to calcifications in a patient with Fahr’s disease
Fig. 7
Fig. 7
High signal intensity of the basal ganglia and left thalamus (arrows) on FSE T2WI (a) and FLAIR (b) in a patient known for Wilson’s disease
Fig. 8
Fig. 8
Bright confluent foci in the right thalamus on axial and coronal (a, b) FLAIR, not associated with mass effect or surrounding oedema. Absence of hypervascularisation on perfusion MR (b, c) further confirms the benign nature of these lesions allowing differentiation between primary brain tumour such as astrocytoma or glioblastoma and benign lesions. These are FASIs of a patient with NF1
Fig. 9
Fig. 9
There is a hyperdense lesion on non-contrast surrounded by oedema (arrow in a). Follow-up MRI shows resolution of the oedema and low signal intensity of the lesion on all sequences including T2 (b), T2* (c), FLAIR (d), DWI b1000 (e), ADC map (f), non-contrast T1 (g), and T1 post contrast (h) reflecting the expected progression of a subacute into chronic haematoma in a patient with hypertension
Fig. 10
Fig. 10
High signal intensity on FLAIR in the left thalamus (arrow in a) associated with a “bag of worms” appearance on 3D TOF (arrow in b). DSA and 3D TOF reformat (e) demonstrate abnormal vessels corresponding to the nidus of an AVM (arrows in c and d)
Fig. 11
Fig. 11
High signal intensity of both thalami (arrows in a) associated with diffusion restriction in the same area (arrows in b and c) consistent with ischaemia due to occlusion of the artery of Percheron (anatomic variant). 3D TOF shows stenosis of the P1 segment of the left posterior cerebral artery (arrowheads in d). The Percheron artery itself is not visible
Fig. 12
Fig. 12
DWI illustrates hyperintensity of both thalami (arrows in a), the lentiform nuclei (arrowheads in a), and caudate (asterisk in a) following cardiac arrest. Note hyperintensity in the same regions on T2WI (b) corresponding to ischaemia due to hypoxia
Fig. 13
Fig. 13
Non-contrast CT shows high attenuation of the internal cerebral veins and the vein of Gallen (arrows in a). CTV illustrates filling defect in the inferior sagittal sinus, vein of Gallen, and straight sinus (arrows in b). Both thalami (asterisk) are hypodense on CT (a), hyperintense on T2 (c) and FLAIR (d), hypointense on T1 (g), and show no enhancement (h). There is no diffusion restriction (e, f) reflecting vasogenic oedema secondary to venous thrombosis
Fig. 14
Fig. 14
Ovoid lesion in the right thalamus producing mass effect on the third ventricle, which is hyperintense on T2 (arrow in a), shows slight peripheral low signal intensity on T2* (arrow in b), is hypointense on T1 (arrow in c), and shows diffusion restriction (arrows in d and e) and ring enhancement (arrow in f). This is a pyogenic abscess
Fig. 15
Fig. 15
FLAIR hyperintensity in the right temporal and insular regions (arrows in a) reflecting brain ischaemia. An epileptic seizure ensued due to cortical involvement, which in turn resulted in high signal intensity on DWI b1000 in the right thalamus (arrow in b) as a consequence
Fig. 16
Fig. 16
Coronal 3D T2WI fused with CT image shows electrodes of deep brain stimulation (DBS) in both subthalamic nuclei

Similar articles

Cited by

References

    1. Singh V. Textbook of clinical neuroanatomy. Noida: Elsevier; 2004.
    1. Schmahmann JD. Vascular syndromes of the thalamus. Stroke. 2003;34:2264–2278. doi: 10.1161/01.STR.0000087786.38997.9E. - DOI - PubMed
    1. Dalrymple-Alford JC, Harland B, Loukavenko EA, et al. Anterior thalamic nuclei lesions and recovery of function: relevance to cognitive thalamus. Neurosci Biobehav Rev. 2015;54:145–160. doi: 10.1016/j.neubiorev.2014.12.007. - DOI - PubMed
    1. Caplan LR, DeWitt LD, Pessin MS, Gorelick PB, Adelman LS. Lateral thalamic infarcts. Arch Neurol. 1988;45:959–964. doi: 10.1001/archneur.1988.00520330037008. - DOI - PubMed
    1. Luco C, Hoppe A, Schweitzer M, Vicuña X, Fantin A (1992) Visual field defects in vascular lesions of the lateral geniculate body. J Neurol Neurosurg Psychiatry 55:12–15 - PMC - PubMed

LinkOut - more resources