

Diffusion-weighted magnetic resonance imaging using a preclinical 1 T PET/MRI in healthy and tumor-bearing rats
- PMID: 30796555
- PMCID: PMC6386759
- DOI: 10.1186/s13550-019-0489-6
Diffusion-weighted magnetic resonance imaging using a preclinical 1 T PET/MRI in healthy and tumor-bearing rats
Abstract
Background: Hybrid positron emission tomography and magnetic resonance imaging (PET/MRI) scanners are increasingly used for both clinical and preclinical imaging. Especially functional MRI sequences such as diffusion-weighted imaging (DWI) are of great interest as they provide information on a molecular level, thus, can be used as surrogate biomarkers. Due to technical restrictions, MR sequences need to be adapted for each system to perform reliable imaging. There is, to our knowledge, no suitable DWI protocol for 1 Tesla PET/MRI scanners. We aimed to establish such DWI protocol with focus on the choice of b values, suitable for longitudinal monitoring of tumor characteristics in a rat liver tumor model.
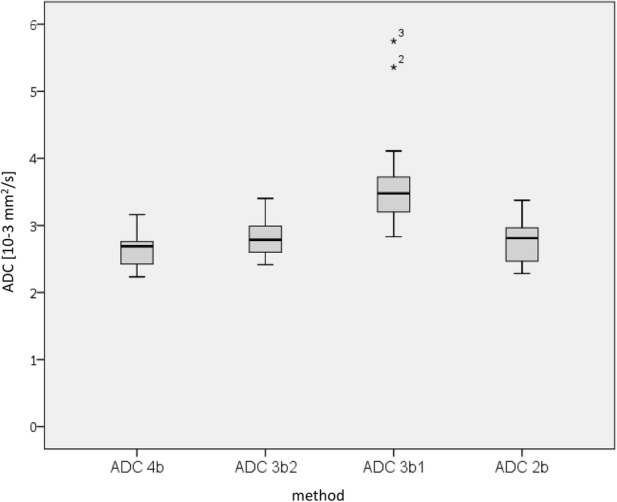
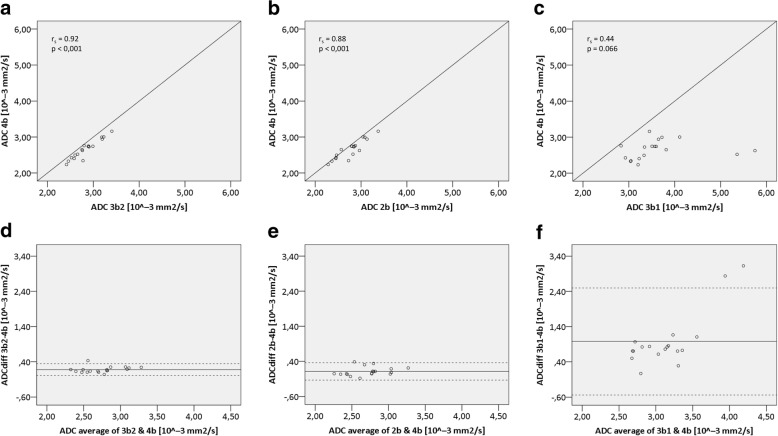
Material and methods: DWI was first performed in 18 healthy rat livers using the scanner-dependent maximum of 4 b values (0, 100, 200, 300 s/mm2). Apparent diffusion coefficients (ADC) were calculated from different b value combinations and compared to the reference measurement with four b values. T2-weighted MRI and optimized DWI with best agreement between accuracy, scanning time, and system performance stability were used to monitor orthotopic hepatocellular carcinomas (HCC) in five rats of which three underwent additional 2-deoxy-2-(18F)fluoro-D-glucose(FDG)-PET imaging. ADCs were calculated for the tumor and the surrounding liver parenchyma and verified by histopathological analysis.
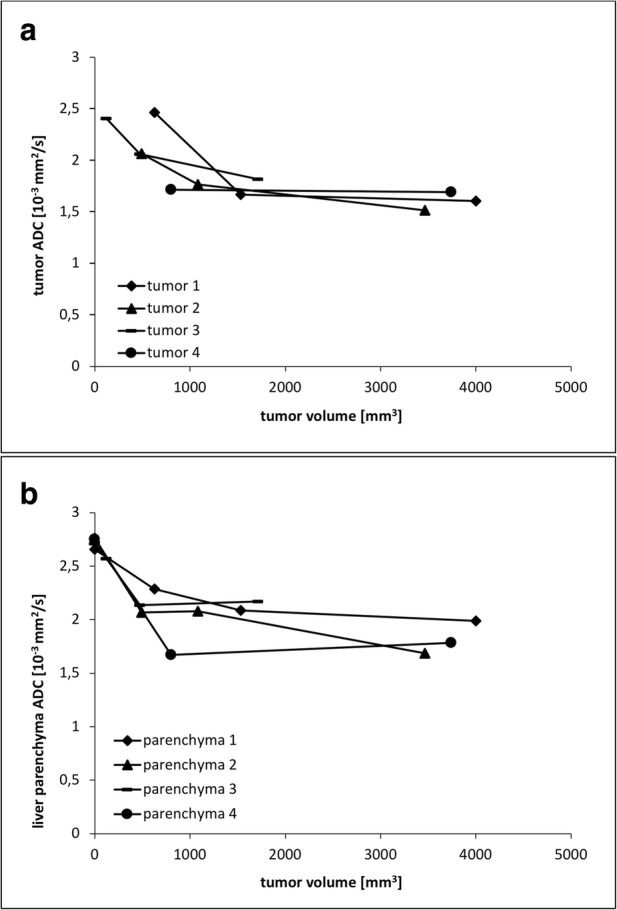
Results: Compared to the reference measurements, the combination b = 0, 200, 300 s/mm2 showed the highest correlation coefficient (rs = 0.92) and agreement while reducing the acquisition time. However, measurements with less than four b values yielded significantly higher ADCs (p < 0.001). When monitoring the HCC, an expected drop of the ADC was observed over time. These findings were paralleled by FDG-PET showing both an increase in tumor size and uptake heterogeneity. Interestingly, surrounding liver parenchyma also showed a change in ADC values revealing varying levels of inflammation by immunohistochemistry.
Conclusion: We established a respiratory-gated DWI protocol for a preclinical 1 T PET/MRI scanner allowing to monitor growth-related changes in ADC values of orthotopic HCC liver tumors. By monitoring the changes in tumor ADCs over time, different cellular stages were described. However, each study needs to adapt the protocol further according to their question to generate best possible results.
Keywords: 1 Tesla; ADC; DWI; Hepatocellular carcinoma; PET/MRI; Preclinical; Rats; Tumor microenvironment.
Conflict of interest statement
Ethics approval and consent to participate
All animal experiments were performed in accordance with national and local guidelines for animal welfare and were approved by the animal ethics committee of the state Berlin (LAGeSo, Reg. No. G0059/14).
Consent for publication
Not applicable.
Competing interests
The authors MB and GM work for Mediso Ltd., the company that has developed the nanoScan PET/MRI we used in this study. The other authors have no conflicts of interest to declare.
Publisher’s Note
Springer Nature remains neutral with regard to jurisdictional claims in published maps and institutional affiliations.
Figures


References
-
- Mardor Y, Pfeffer R, Spiegelmann R, Roth Y, Maier SE, Nissim O, et al. Early detection of response to radiation therapy in patients with brain malignancies using conventional and high b-value diffusion-weighted magnetic resonance imaging. J Clin Oncol. 2003;21(6):1094–1100. - PubMed
-
- Pickles MD, Gibbs P, Lowry M, Turnbull LW. Diffusion changes precede size reduction in neoadjuvant treatment of breast cancer. Magn Reson Imaging. 2006;24(7):843–847. - PubMed
-
- Chenevert TL, McKeever PE, Ross BD. Monitoring early response of experimental brain tumors to therapy using diffusion magnetic resonance imaging. Clin Cancer Res. 1997;3(9):1457–1466. - PubMed
-
- Thoeny HC, De Keyzer F, Vandecaveye V, Chen F, Sun X, Bosmans H, et al. Effect of vascular targeting agent in rat tumor model: dynamic contrast-enhanced versus diffusion-weighted MR imaging. Radiology. 2005;237(2):492–499. - PubMed
Grants and funding
LinkOut - more resources
Full Text Sources
