. 2019 Sep;29(9):4678-4690.
doi: 10.1007/s00330-019-06020-2. Epub 2019 Feb 22.

Amount of fibroglandular tissue FGT and background parenchymal enhancement BPE in relation to breast cancer risk and false positives in a breast MRI screening program : A retrospective cohort study

Affiliations

Amount of fibroglandular tissue FGT and background parenchymal enhancement BPE in relation to breast cancer risk and false positives in a breast MRI screening program : A retrospective cohort study

Suzan Vreemann et al. Eur Radiol. 2019 Sep.

Abstract

Objectives: The purpose of this study is to evaluate the predictive value of the amount of fibroglandular tissue (FGT) and background parenchymal enhancement (BPE), measured at baseline on breast MRI, for breast cancer development and risk of false-positive findings in women at increased risk for breast cancer.

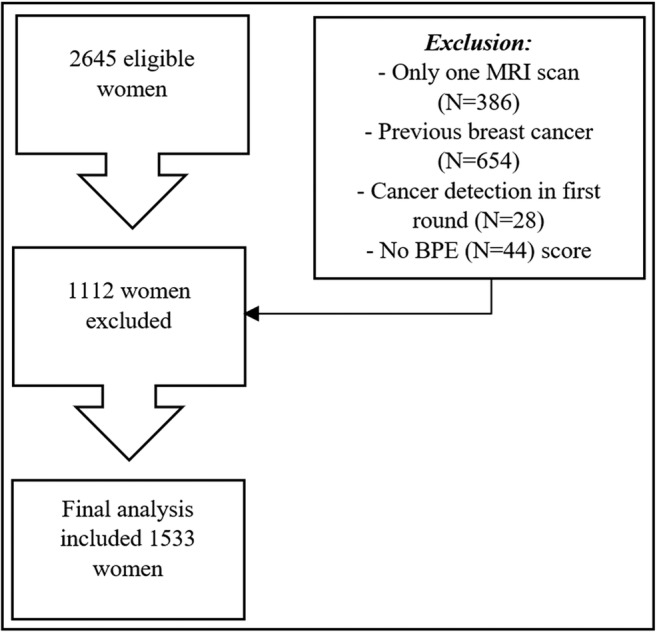
Methods: Negative baseline MRI scans of 1533 women participating in a screening program for women at increased risk for breast cancer between January 1, 2003, and January 1, 2014, were selected. Automated tools based on deep learning were used to obtain quantitative measures of FGT and BPE. Logistic regression using forward selection was used to assess relationships between FGT, BPE, cancer detection, false-positive recall, and false-positive biopsy.

Results: Sixty cancers were detected in follow-up. FGT was only associated to short-term cancer risk; BPE was not associated with cancer risk. High FGT and BPE did lead to more false-positive recalls at baseline (OR 1.259, p = 0.050, and OR 1.475, p = 0.003) and to more frequent false-positive biopsies at baseline (OR 1.315, p = 0.049, and OR 1.807, p = 0.002), but were not predictive for false-positive findings in subsequent screening rounds.

Conclusions: FGT and BPE, measured on baseline MRI, are not predictive for overall breast cancer development in women at increased risk. High FGT and BPE lead to more false-positive findings at baseline.

Key points: • Amount of fibroglandular tissue is only predictive for short-term breast cancer risk in women at increased risk. • Background parenchymal enhancement measured on baseline MRI is not predictive for breast cancer development in women at increased risk. • High amount of fibroglandular tissue and background parenchymal enhancement lead to more false-positive findings at baseline MRI.

Keywords: Breast; Breast neoplasms; Magnetic resonance imaging; Risk factors.


Conflict of interest statement

The authors declare that they have no competing interests.

Figures

Fig. 1
Fig. 1
Flow diagram of the case selection procedure. BPE, background parenchymal enhancement; FGT, amount of fibroglandular tissue
Fig. 2
Fig. 2
An example of the steps of the automated tool to determine the amount of fibroglandular tissue (FGT) and background parenchymal enhancement (BPE). First, the original image (a), then the breasts and parenchymal tissue (b) are segmented, and finally, relative enhancement values are computed for the segmented FGT volumes (c). BPE values are extracted from the enhancing voxels within the parenchymal tissue, based on these relative enhancement values
Fig. 3
Fig. 3
Distribution of the amount of fibroglandular tissue (FGT) for women with a BRCA mutation and women without a BRCA mutation. In a, box plots show the lowest and highest FGT values (outermost horizontal lines), median FGT (central horizontal line), and interquartile range (top and bottom borders of the box) for breast cancer (no/yes). Scatter plots show the association of FGT to breast cancer occurrence (no/yes) and age at baseline MRI (b). In c, boxplots are shown for false-positive recall occurrence (no/yes), and in d, scatterplots show the association of FGT to false-positive recall occurrence
Fig. 4
Fig. 4
Distribution of the background parenchymal enhancement (BPE) for women with a BRCA mutation and women without a BRCA mutation. In a, box plots show the lowest and highest BPE values (outermost horizontal lines), median BPE (central horizontal line), and interquartile range (top and bottom borders of the box) for breast cancer (no/yes). Scatter plots show the association of BPE to breast cancer occurrence (no/yes) and age at baseline MRI (b). In c, boxplots are shown for false-positive recall occurrence (no/yes), and in d, scatterplots show the association of BPE to false-positive recall occurrence

Similar articles

Cited by

References

    1. Mann RM, Kuhl CK, Kinkel K, Boetes C. Breast MRI: guidelines from the European Society of Breast Imaging. Eur Radiol. 2008;18:1307–1318. doi: 10.1007/s00330-008-0863-7. - DOI - PMC - PubMed
    1. Saslow D, Boetes C, Burke W, et al. American Cancer Society guidelines for breast screening with MRI as an adjunct to mammography. CA Cancer J Clin. 2007;57:75–89. doi: 10.3322/canjclin.57.2.75. - DOI - PubMed
    1. Domchek SM, Eisen A, Calzone K, Stopfer J, Blackwood A, Weber BL. Application of breast cancer risk prediction models in clinical practice. J Clin Oncol. 2003;21:593–601. doi: 10.1200/JCO.2003.07.007. - DOI - PubMed
    1. Cintolo-Gonzalez JA, Braun D, Blackford AL, et al. Breast cancer risk models: a comprehensive overview of existing models, validation, and clinical applications. Breast Cancer Res Treat. 2017;164:263–284. doi: 10.1007/s10549-017-4247-z. - DOI - PubMed
    1. Holm J, Humphreys K, Li J, et al. Risk factors and tumor characteristics of interval cancers by mammographic density. J Clin Oncol. 2015;33:1030–1037. doi: 10.1200/JCO.2014.58.9986. - DOI - PubMed