. 2019 Jan;6(1):015005.
doi: 10.1117/1.NPh.6.1.015005. Epub 2019 Feb 8.

Light-sheet fluorescence expansion microscopy: fast mapping of neural circuits at super resolution

Affiliations

Light-sheet fluorescence expansion microscopy: fast mapping of neural circuits at super resolution

Jana Bürgers et al. Neurophotonics. 2019 Jan.

Abstract

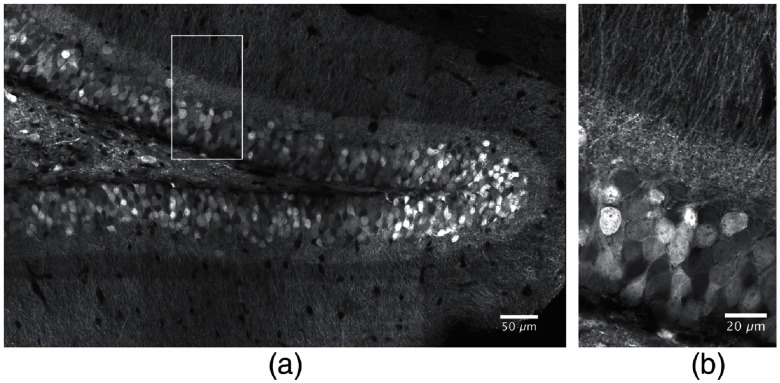
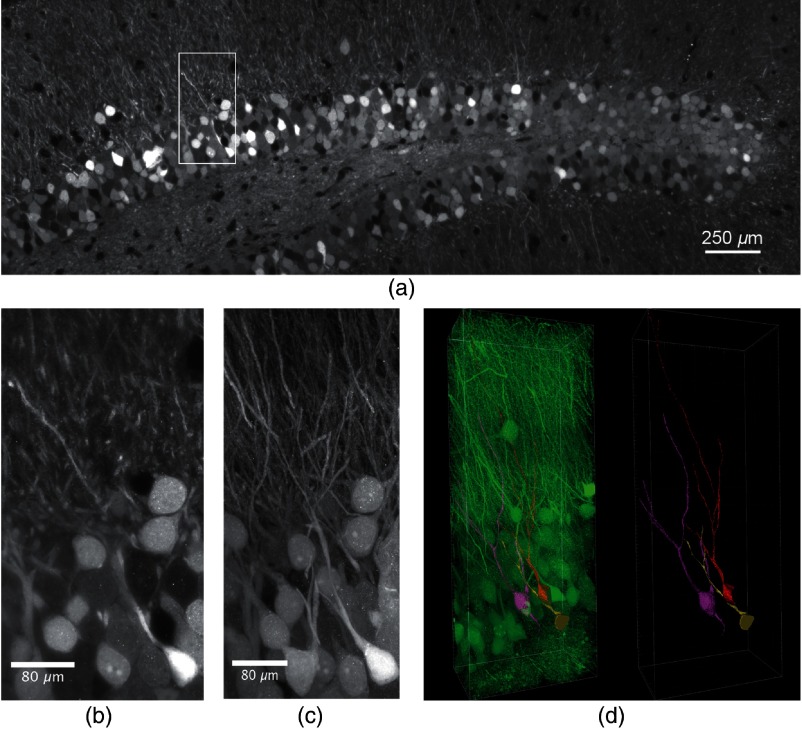
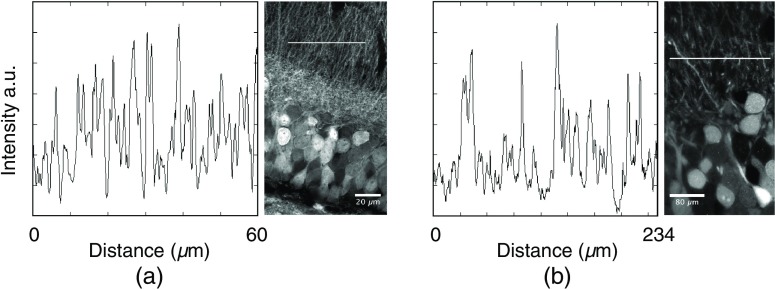
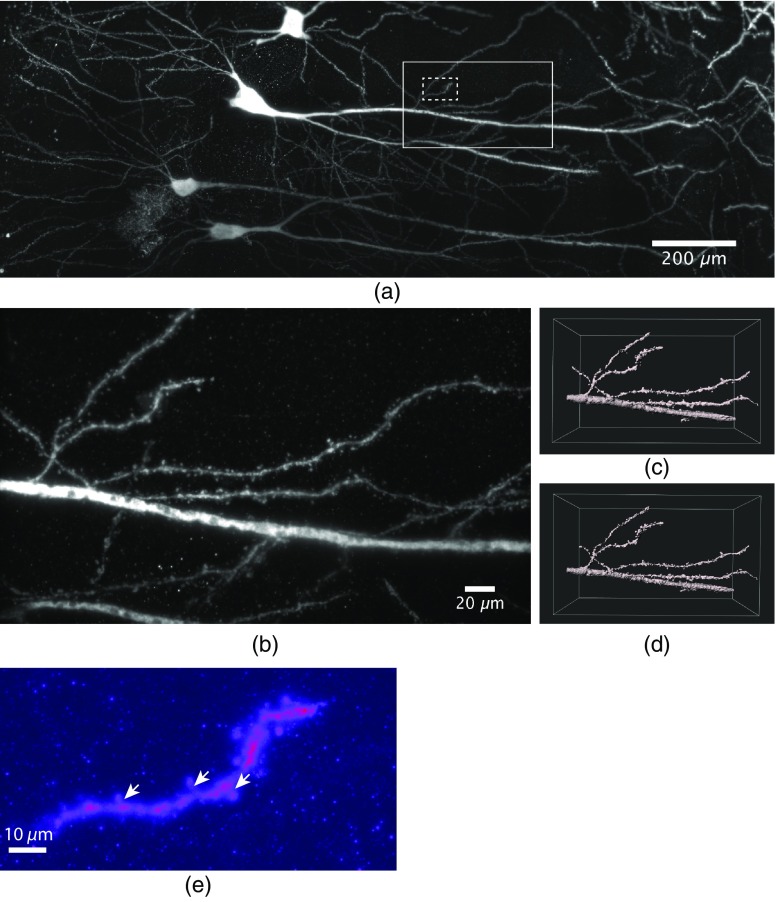
The goal of understanding the architecture of neural circuits at the synapse level with a brain-wide perspective has powered the interest in high-speed and large field-of-view volumetric imaging at subcellular resolution. Here, we developed a method combining tissue expansion and light-sheet fluorescence microscopy to allow extended volumetric super resolution high-speed imaging of large mouse brain samples. We demonstrate the capabilities of this method by performing two color fast volumetric super resolution imaging of mouse CA1 and dentate gyrus molecular-, granule cell-, and polymorphic layers. Our method enables an exact evaluation of granule cell and neurite morphology within the context of large cell ensembles spanning several orders of magnitude in resolution. We found that imaging a brain region of 1 mm 3 in super resolution using light-sheet fluorescence expansion microscopy is about 17-fold faster than imaging the same region by a current state-of-the-art high-resolution confocal laser scanning microscope.

Keywords: connectomics; dentate gyrus; light-sheet fluorescence microscopy; super resolution; tissue expansion.


Figures

Fig. 1
Fig. 1
Coronal section of a dorsal mouse dentate gyrus containing EGFP-expressing granule cells imaged by high-resolution confocal microscopy. The endogenous EGFP fluorescence was enhanced by antibody staining against EGFP (see Sec. 4). (a) A single confocal plane acquired using an Airyscan detector and a 40× 1.2 NA WI imaging objective lens. The total field size in (a) was 742×452  μm2, achieved by combining 8×5 single image stacks comprising 2048×2048  pixels in each frame. The individual tile stacks were acquired with 10% spatial overlap to enable efficient stitching using the algorithm described in Ref. . (b) Magnification of the ROI marked in Fig. 1(a).
Fig. 2
Fig. 2
Expanded, antibody-stained mouse brain slice imaged by LSFM. The sample was expanded and imaged with a custom-built light-sheet microscope. In total 70 z-stacks with a step size of 1  μm, covering a depth of 275  μm with 30% overlap were stitched to generate the image. (a) Single plane of the stitched volume at a depth of 65  μm. The total volume shown after expansion was 3600×1240×275  μm3 (Video 1, MP4, 32 MB [URL: https://doi.org/10.1117/1.NPh.6.1.015005.1]). (b) Magnification of the region marked in (a), lateral field size 254×492  μm2. (c) Maximum projection of the selected region marked in (a) comprising 76 slices of the stack, lateral field size 254×492  μm2. Single granule cells and dendrites can well be distinguished and separated. The stack was median-filtered to remove staining artifacts before the maximum projection. (d) Segmentation and tracing of the neurites of three selected granule cells (Video 2, MP4, 19 MB [URL: https://doi.org/10.1117/1.NPh.6.1.015005.2]). Left panel: segmented GCs in the neuronal network, right panel: segmented GCs with traced neurites.
Fig. 3
Fig. 3
Contrast in Airyscan and LSFM microscopy images. (a) Line profile determined in a 0.3-μm-wide line with a length of 60  μm. The right panel shows the position of the line in Fig. 1(b). (b) Line profile determined in a 3.9×0.3  μm wide line with a length of 3.9×60  μm. The right panel shows the position of the line in Fig. 2(b).
Fig. 4
Fig. 4
Dendritic segments of sparsely labeled pyramidal neurons in CA1. (a) Maximum projection of a total of 24 stacks with an axial step size of 0.3  μm covering a depth of 450  μm were acquired and stitched together (Video 3, MP4, 39 MB [URL: https://doi.org/10.1117/1.NPh.6.1.015005.3]). The sparse labeling and small axial imaging step size allowed to reconstruct the labeled granule cells and dendrites over distances of 1.3 mm after expansion. (b) Magnification of the large ROI marked in (a). The high virtual optical resolution allowed to identify finest detail, e.g., the morphology of individual synaptic spines. (c) 3-D surface rendering of a region of the data shown in (b), the dimensions were 256×152×205  μm3. (d) Deconvolution of the image data using the experimental PSF yielded a significant increase in data quality (Video 4, MP4, 4 MB [URL: https://doi.org/10.1117/1.NPh.6.1.015005.4]). (e) A maximum projection of 250 frames of a magnified region of the image stack shown in (a) (see dashed ROI) containing a single dendrite demonstrates that even dendritic spine necks (arrows) can be recognized.
Fig. 5
Fig. 5
Multicolor imaging of sparsely labeled pyramidal neurons in CA1 imaged by LSFEM. (a) Maximum intensity projection of an expanded mouse brain slice expressing EGFP. The endogenous EGFP fluorescence was enhanced by antibody staining against EGFP, the secondary antibody was conjugated to Alexa 488. The total axial extension was 390  μm. (b) Magnification of the ROI marked in (a). Dendrites were stained with Alexa488 (blue), postsynaptic proteins (shank2) stained with Alexa568 (green), presynaptic proteins (bassoon) stained with Alexa647 (red). The shown images were deconvolved. (c) Magnification a region indicated in (b) (white arrow), lateral field size 17.3×17.3  μm2, indicating synaptic connectivity. The right panel in (c) shows the intensity profiles along the dotted line. (d) 3-D surface rendering of the synapse region shown in (c).
Fig. 6
Fig. 6
Two-color imaging of mossy fibers and GABAergic interneurons in DG. (a) Mossy fibers in the hilus area expressing EGFP. The endogenous EGFP fluorescence was enhanced by antibody staining against EGFP, the secondary antibody was conjugated to Alexa 488 (green). Parvalbumin staining identified GABAergic interneurons shown in red (Video 5, MP4, 65 MB [URL: https://doi.org/10.1117/1.NPh.6.1.015005.5]). 1500 optical slices were acquired with a step size of 0.3  μm, the shown data were deconvolved. Volume size 456×945×390  μm3. (b) Side view of the data shown in (a). (c) Segmented parvalbumin cells and mossy fibers reconstructed in 3-D. Magnification of the ROI marked in (b), showing connection between the cells.

Similar articles

Cited by

References

    1. Ramón S., Cajal Y., Textura del sistema nervioso del hombre y de los vertebrados, Imprenta y Librería de Nicolás Moya, Madrid: (1899–1904).
    1. Mikula S., Denk W., “High-resolution whole-brain staining for electron microscopic circuit reconstruction,” Nat. Methods 12(6), 541–546 (2015).10.1038/nmeth.3361 - DOI - PubMed
    1. Osten P., Margrie T. W., “Mapping brain circuitry with a light microscope,” Nat. Methods 10(6), 515–523 (2013).10.1038/nmeth.2477 - DOI - PMC - PubMed
    1. Conchello J.-A., Lichtman J. W., “Optical sectioning microscopy,” Nat. Methods 2(12), 920–931 (2005).10.1038/nmeth815 - DOI - PubMed
    1. Helmchen F., Denk W., “Deep tissue two-photon microscopy,” Nat. Methods 2(12), 932–940 (2005).10.1038/nmeth818 - DOI - PubMed