. 2019 Feb:20:72-84.
doi: 10.1016/j.lssr.2019.01.003. Epub 2019 Jan 15.

Effects of low-dose oxygen ions and protons on cardiac function and structure in male C57BL/6J mice

Affiliations

Effects of low-dose oxygen ions and protons on cardiac function and structure in male C57BL/6J mice

John W Seawright et al. Life Sci Space Res (Amst). 2019 Feb.

Abstract

Purpose: Astronauts traveling beyond low-Earth orbit will be exposed to high linear-energy transfer charged particles. Because there is concern about the adverse effects of space radiation on the cardiovascular system, this study assessed cardiac function and structure and immune cell infiltration in a mouse model of charged-particle irradiation.

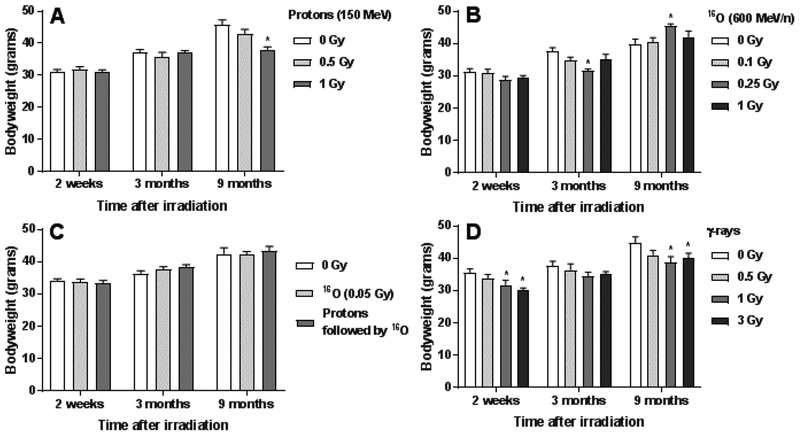
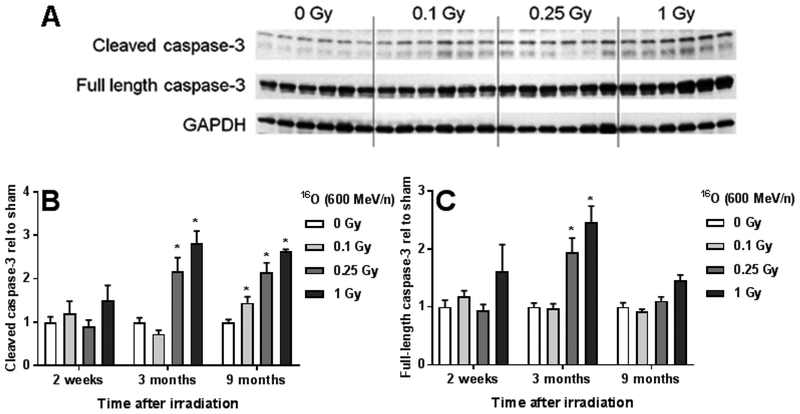
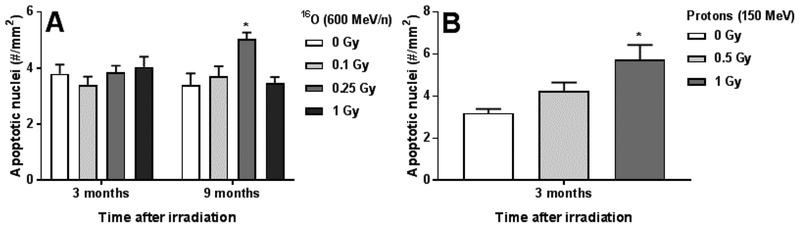
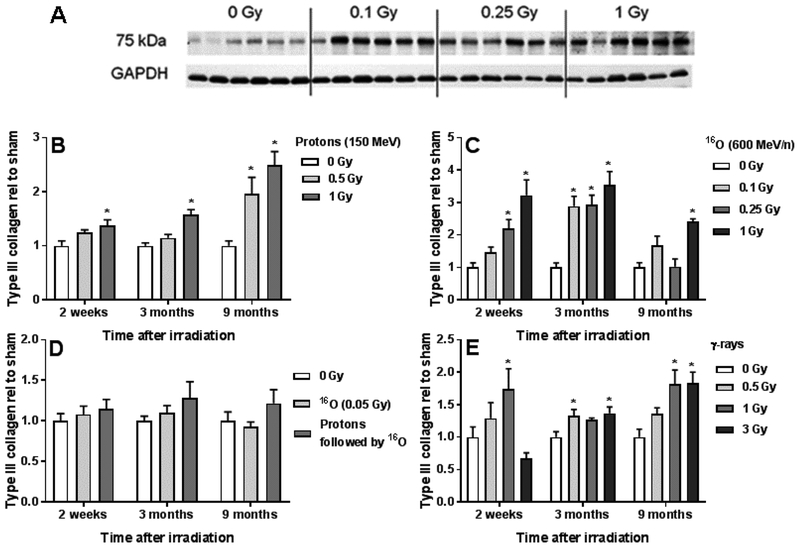
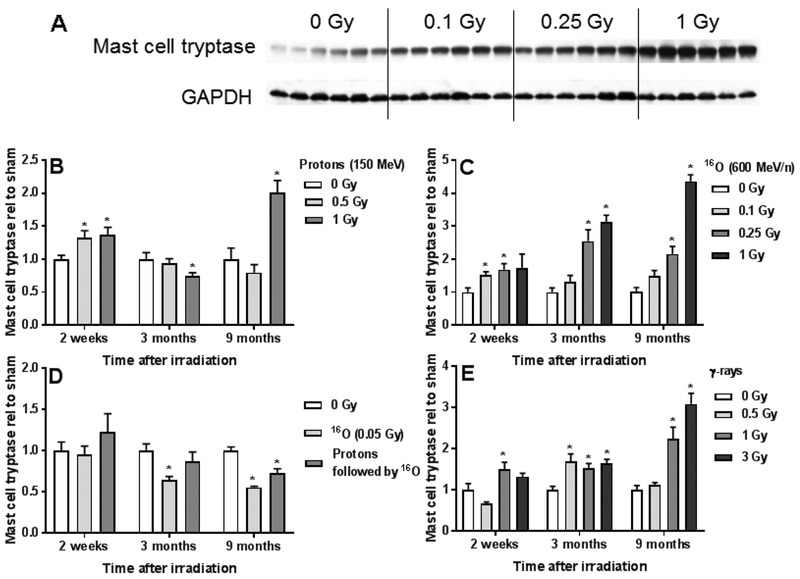
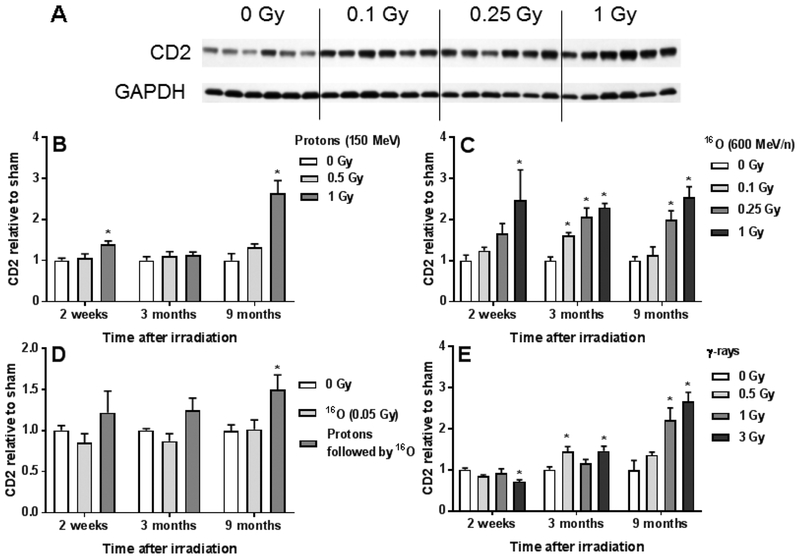
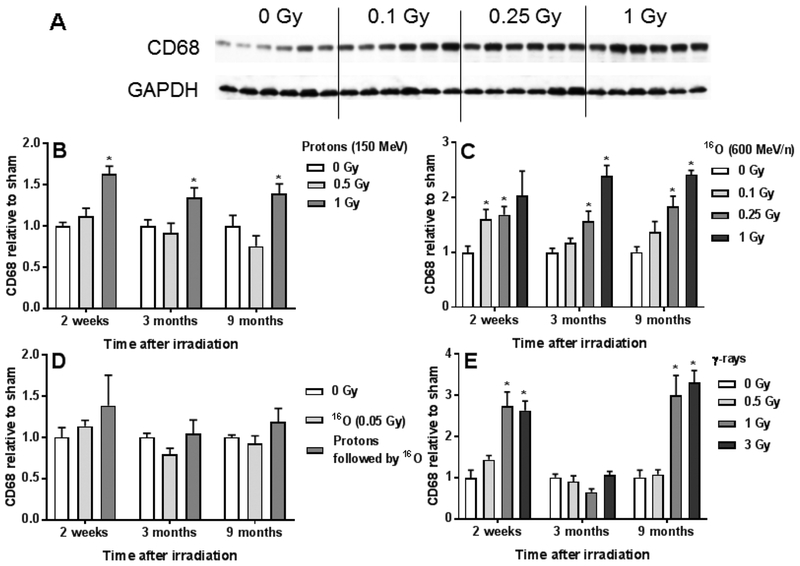
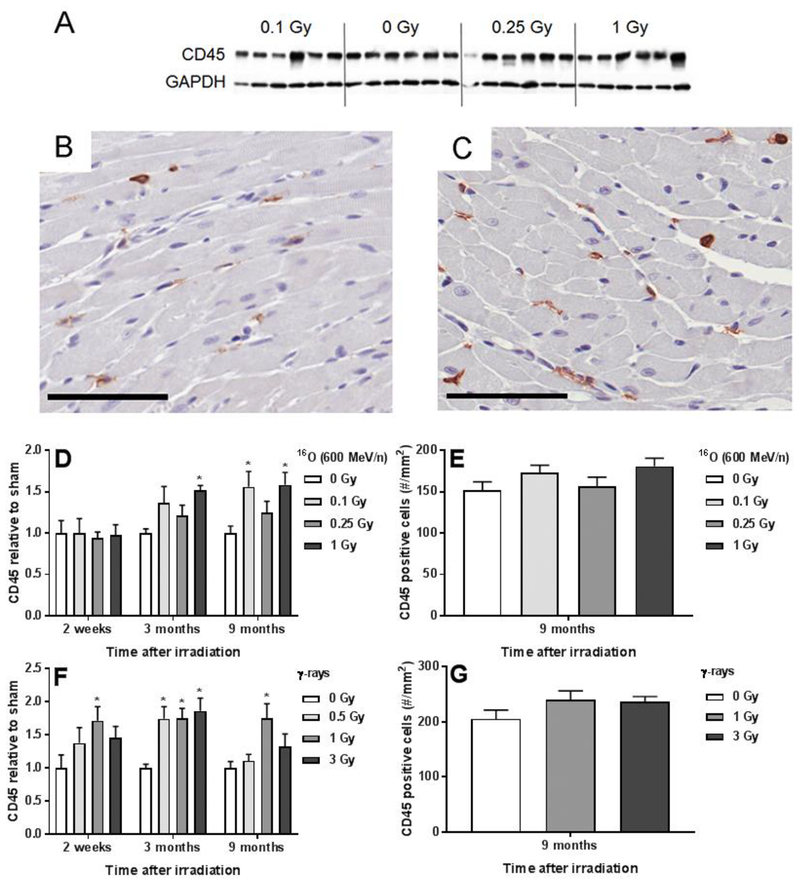
Materials and methods: Male C57BL/6 J mice were exposed to oxygen ions (16O, 600 MeV/n at 0.25-0.26 Gy/min to a total dose of 0, 0.05, 0.1, 0.25, or 1 Gy), protons (150 MeV, 0.35-0.55 Gy/min to 0, 0.5, or 1 Gy), or protons (150 MeV, 0.5 Gy) followed by 16O (600 MeV/n, 0.1 Gy). Separate groups of mice received 137Cs γ-rays (1 Gy/min to 0, 0.5, 1, or 3 Gy) as a reference. Cardiac function and blood velocity were measured with ultrasonography at 3, 5, 7, and 9 months after irradiation. At 2 weeks, 3 months, and 9 months, cardiac tissue was collected to assess apoptosis, tissue remodeling, and markers of immune cells.

Results: Ejection fraction and fractional shortening decreased at 3 and 7 months after 16O. These parameters did not change in mice exposed to γ-rays, protons, or protons followed by 16O. Each of the radiation exposures caused only small increases in cleaved caspase-3 and numbers of apoptotic nuclei. Changes in the levels of α-smooth muscle cell actin and a 75-kDa peptide of collagen type III in the left ventricle suggested tissue remodeling, but there was no significant change in total collagen deposition at 2 weeks, 3 months, and 9 months. Increases in protein amounts of cluster of differentiation (CD)2, CD68, and CD45 as measured with immunoblots at 2 weeks, 3 months, and 9 months after exposure to protons or 16O alone suggested immune cell infiltration. For type III collagen, CD2 and CD68, the efficacy in inducing protein abundance of CD2, CD68, and CD45 was 16O > protons > γ-rays > protons followed by 16O.

Conclusions: Low-dose, high-energy charged-particle irradiation caused mild changes in cardiac function and tissue remodeling in the mouse.

Keywords: Cardiovascular system; Degenerative tissue effects; Immune cell infiltration; Mouse model; Space radiation.


Conflict of interest statement

Disclosure statement

The authors report no conflicts of interest.

Figures

Figure 1.
Figure 1.. Bodyweight at time of sacrifice.
Bodyweight was measured after exposure to protons (A), 16O (0–1 Gy) (B), 16O (0 and 0.05 Gy) and protons (0.5 Gy) followed by 16O (0.1 Gy) (C), and after γ-rays (D). Graphs indicate average bodyweight and standard error of the mean (SEM); n = 9–15/group. *p<0.05 compared to time-matched sham controls.
Figure 2.
Figure 2.. Effects of radiation on cleaved and full-length caspase-3 after exposure to 16O.
(A) Representative image of immunoblot for cleaved and full-length caspase-3 at 9 months after 16O irradiation. (B) Left ventricle protein levels of cleaved caspase-3 after exposure to 16O (0.1 – 1 Gy). (C) Left ventricle protein levels of full length caspase-3 after exposure to 16O (0.1 – 1 Gy). Left ventricular protein levels were normalized to GAPDH and then calculated relative to time-matched sham-irradiated controls (arbitrary units). Graphs indicate average values and SEM. *p<0.05 compared to time-matched sham controls. n = 6/group.
Figure 3.
Figure 3.. Effects of radiation on apoptosis after exposure to protons or 16O.
Number of apoptotic nuclei per tissue area after exposure to 16O (A) or protons (B). n = 9–15/group. Graphs indicate average values and SEM. *p<0.05 compared to time-matched sham controls.
Figure 4.
Figure 4.. Immunoblot analysis of type III collagen in left ventricle.
(A) Representative image of an immunoblot indicating a 75-kDa band recognized by the anti-collagen III antibody, in samples at 3 months after exposure to 16O. (B) – (E) Left ventricle protein levels of the type III collagen 75-kDa peptide. Left ventricular peptide levels were normalized to GAPDH and then calculated relative to time-matched sham-irradiated controls (arbitrary units). Graphs indicate average values and SEM. n = 5–6/group. *p<0.05 compared to time-matched sham controls.
Figure 5.
Figure 5.. Effects of radiation on mast cell tryptase in the heart.
(A) Representative image of immunoblot for mast cell tryptase at 9 months after 16O exposure. (B) – (E) Mast-cell tryptase abundance in the left ventricle. Left ventricular protein levels were normalized to GAPDH and then calculated relative to time-matched sham-irradiated controls (arbitrary units). Graphs indicate average values and SEM. n = 5–6/group. *p<0.05 compared to time-matched sham controls.
Figure 6.
Figure 6.. CD2 protein levels in the left ventricle.
(A) Representative image of immunoblot for CD2 at 3 months after 16O exposure. (B) CD2 abundance in the left ventricle. Left ventricular protein levels were normalized to GAPDH and then calculated relative to time-matched sham-irradiated controls (arbitrary units). Graphs indicate average values and SEM. n = 5–6/group. *p<0.05 compared to time-matched sham controls.
Figure 7.
Figure 7.. CD68 protein levels in the left ventricle.
(A) Representative image of immunoblot for CD68 at 9 months after 16O exposure. (B) CD68 abundance in the left ventricle. Left ventricular protein levels were normalized to GAPDH and then calculated relative to time-matched sham-irradiated controls (arbitrary units). Graphs indicate average values and SEM. n = 5–6/group. *p<0.05 compared to time-matched sham controls.
Figure 8.
Figure 8.. Effects of radiation on CD45-positive cells in the heart after 16O and γ-rays.
(A) Representative immunoblot of CD45 at 3 months after 16O. Please note that the 0 Gy samples had been loaded on the gel as the second group from the left, to the right of the 0.1 Gy samples. (B) Representative image of CD45 immunohistochemistry, 3 months after sham-irradiation, 40× magnification; Scale bar: 60 μm. (C) Representative image of CD45 immunohistochemistry, 3 months after 16O (0.25 Gy), 40× magnification; Scale bar: 60 μm. (D) Left ventricle protein levels of CD45 after 16O. (E) Number of CD45-positive cells per tissue area at 9 months after 16O. (F) Left ventricle protein levels of CD45 after γ-rays. (G) Number of CD45-positive cells per tissue area at 9 months after γ-rays. In immunoblotting, left ventricular protein levels were normalized to GAPDH and then calculated relative to time-matched sham-irradiated controls (arbitrary units). All graphs indicate average values and SEM. n = 6/group. *p<0.05 compared to time-matched sham controls.

Similar articles

Cited by

References

    1. Chancellor JC, Scott GBI, Sutton JP. Space Radiation: The Number One Risk to Astronaut Health beyond Low Earth Orbit. Life (Basel) 2014; 4:491–510. - PMC - PubMed
    1. Cucinotta FA and Durante M. Cancer risk from exposure to galactic cosmic rays: implications for space exploration by human beings. Lancet Oncol 2006; 7:431–435. - PubMed
    1. Adams MJ, Hardenbergh PH, Constine LS, Lipshultz SE. Radiation-associated cardiovascular disease. Crit Rev Oncol Hematol 2003; 45:55–75. - PubMed
    1. Heidenreich PA, Hancock SL, Vagelos RH, Lee BK, Schnittger I. Diastolic dysfunction after mediastinal irradiation. Am Heart J 2005; 150:977–982. - PubMed
    1. Preston DL, Shimizu Y, Pierce DA, Suyama A, Mabuchi K. Studies of mortality of atomic bomb survivors. Report 13: Solid cancer and noncancer disease mortality: 1950–1997. Radiat Res 2003; 160:381–407. - PubMed